 5
5peptides
spectra
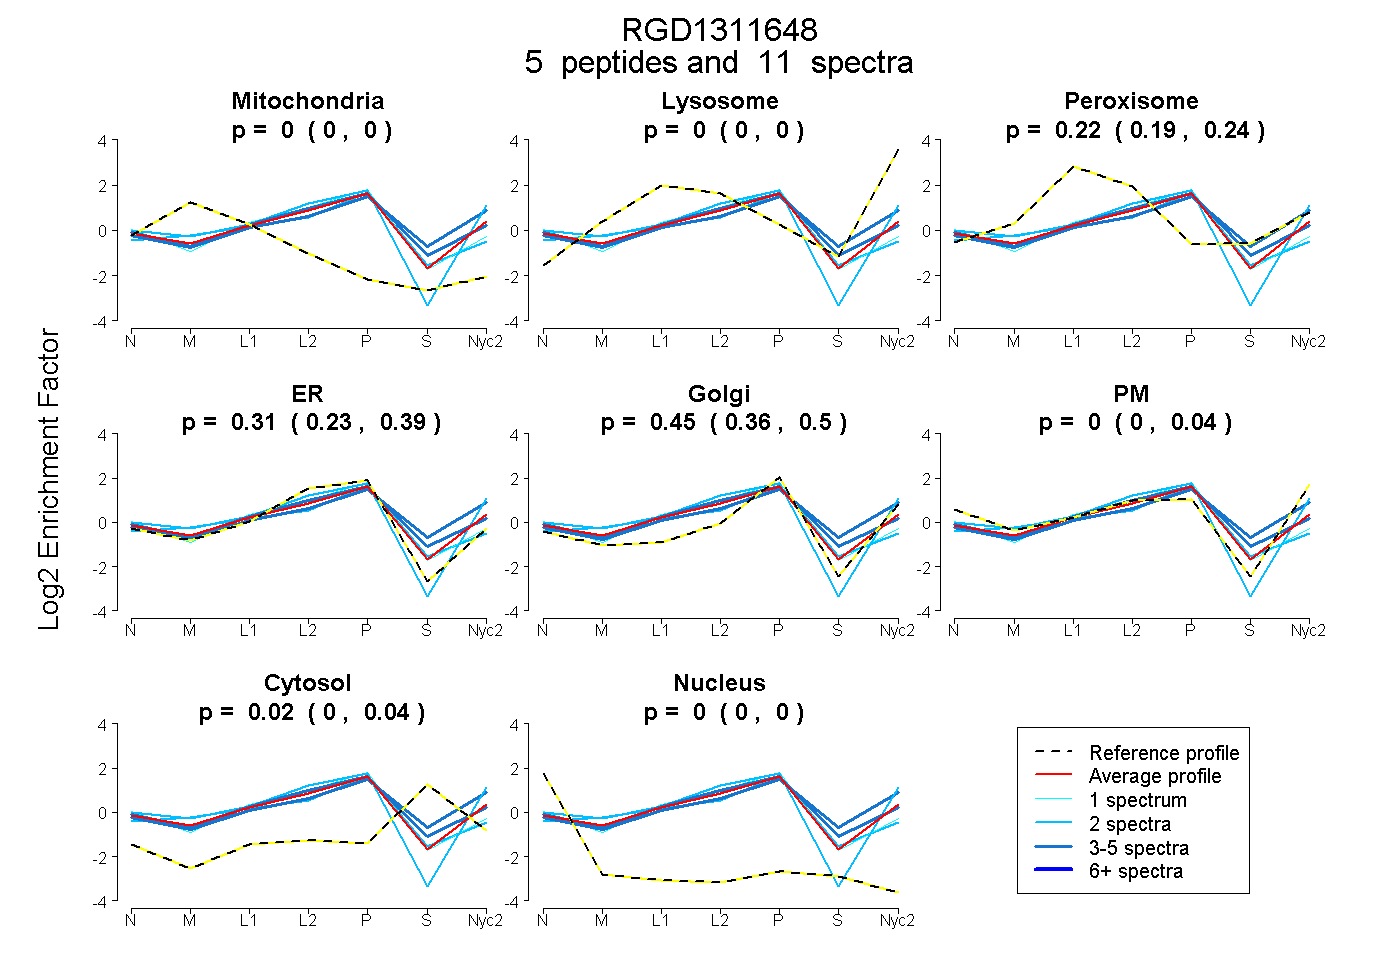
0.000 | 0.000
0.000 | 0.000
0.186 | 0.244
0.225 | 0.391
0.358 | 0.500
0.000 | 0.041
0.000 | 0.045
0.000 | 0.000
3peptides
spectra

0.000 | 0.061
0.177 | 0.396
0.000 | 0.230
0.054 | 0.472
0.070 | 0.381
0.000 | 0.135
0.000 | 0.000
7peptides
spectra
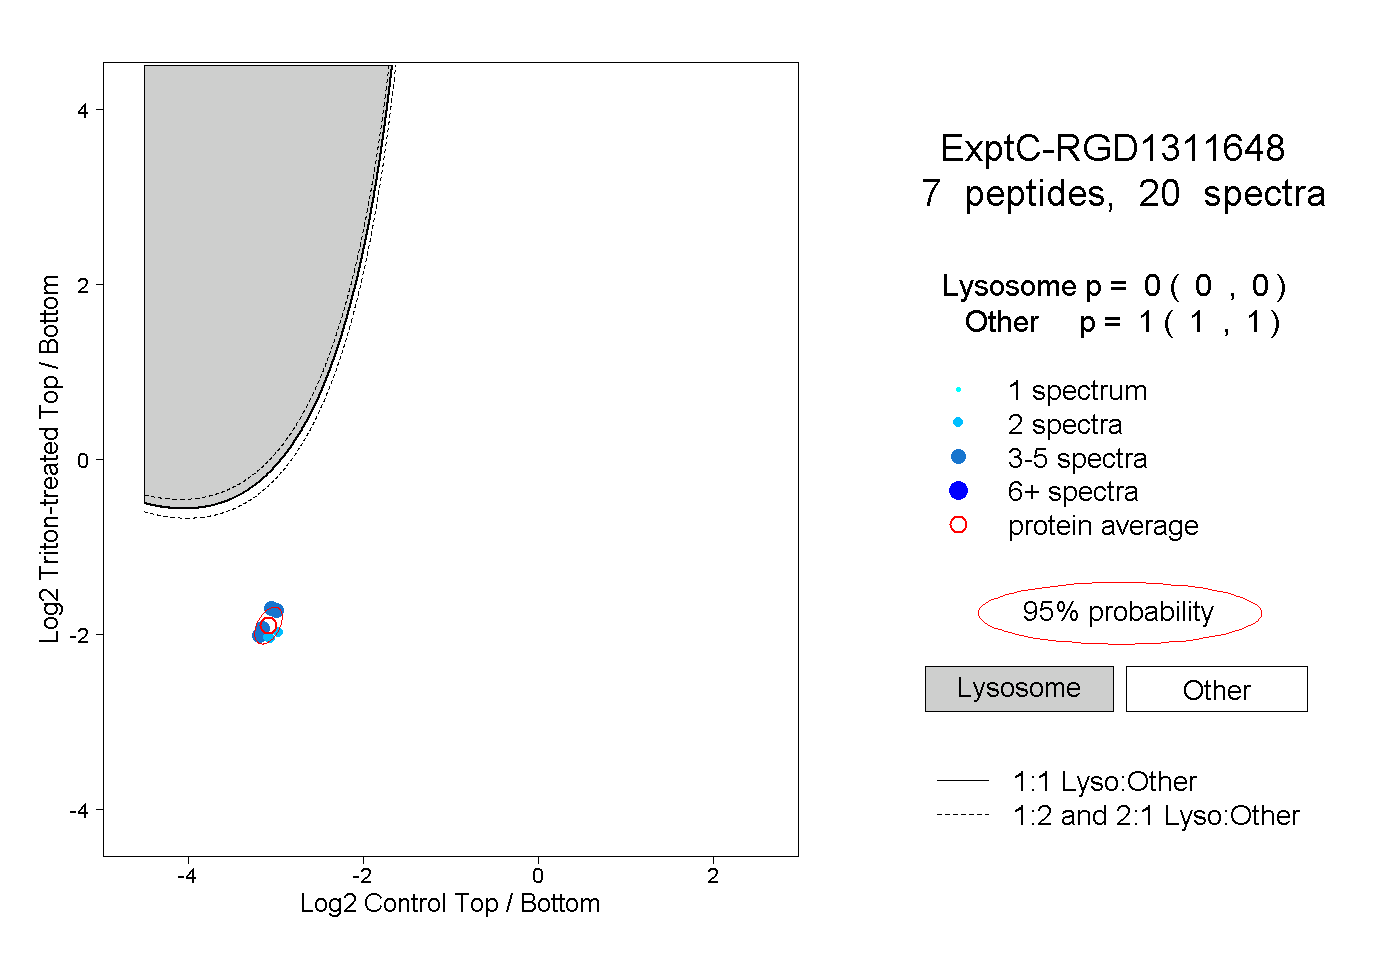
0.000 | 0.000
1.000 | 1.000