RGD1311648
[ENSRNOP00000033708]
Main page
| | | Plot |
Mito |
Lyso |
|
Perox |
ER |
Golgi |
PM |
Cytosol |
Nucleus |
|
| Expt A |
 5
5
peptides |
11
spectra |
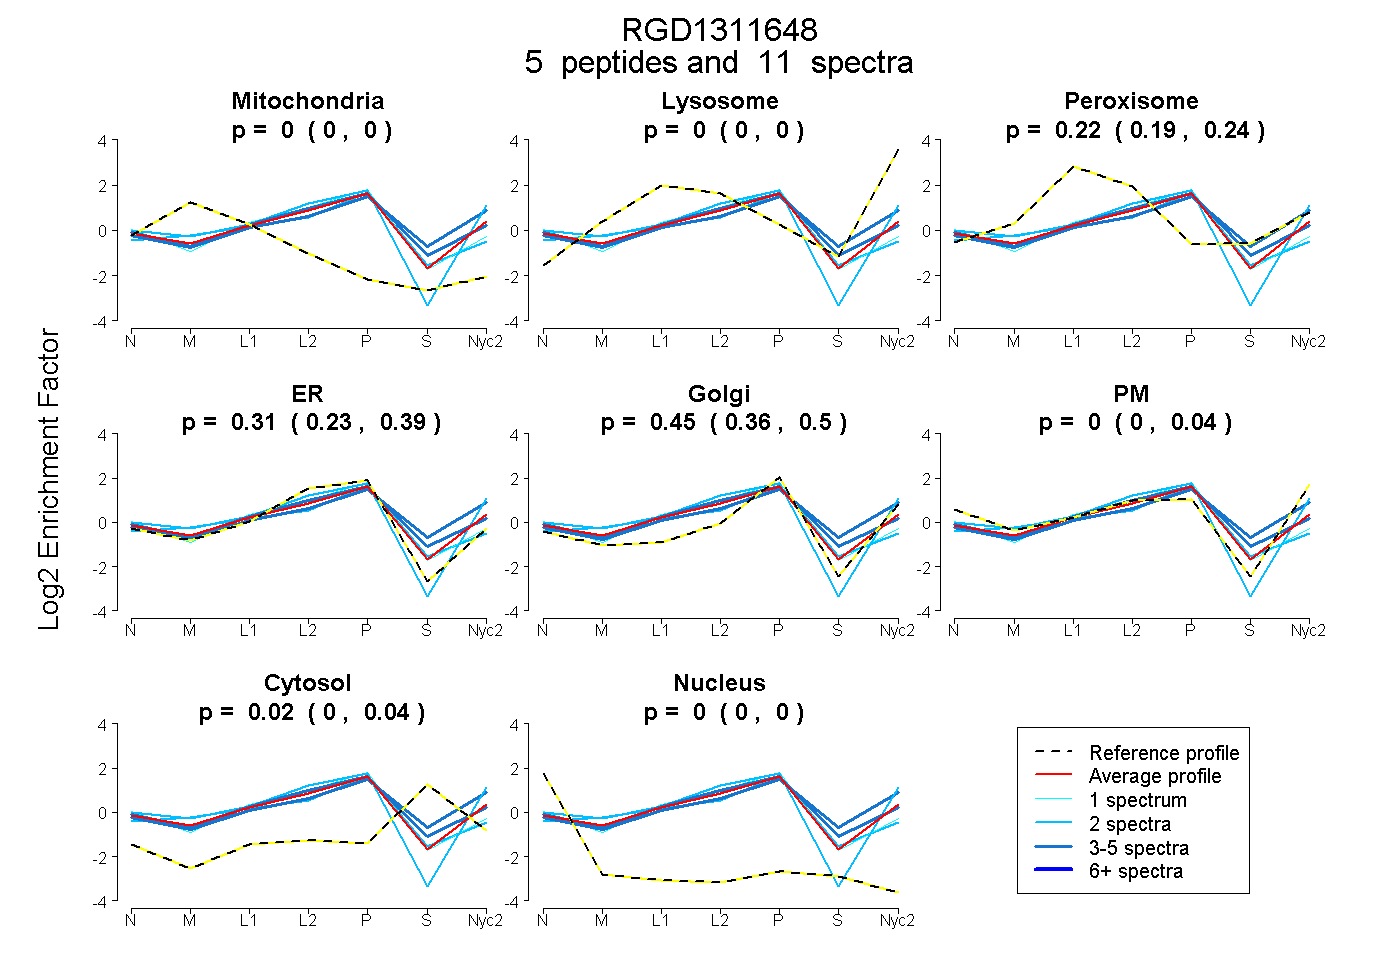 |
0.000
0.000 | 0.000 |
0.000
0.000 | 0.000 |
|
0.222
0.186 | 0.244 |
0.311
0.225 | 0.391 |
0.449
0.358 | 0.500 |
0.000
0.000 | 0.041 |
0.018
0.000 | 0.045 |
0.000
0.000 | 0.000 |
|
| | | Plot |
Mito |
|
Lyso or Perox |
|
ER |
Golgi |
PM |
Cytosol |
Nucleus |
|
| Expt B |
3
peptides |
4
spectra |
 |
0.000
0.000 | 0.061 |
|
0.332
0.177 | 0.396 |
|
0.000
0.000 | 0.230 |
0.372
0.054 | 0.472 |
0.235
0.070 | 0.381 |
0.061
0.000 | 0.135 |
0.000
0.000 | 0.000 |
|
| 1 spectrum, LTFYYGK |
0.023 |
|
0.273 |
|
0.000 |
0.187 |
0.250 |
0.267 |
0.000 |
|
| 2 spectra, FATPFLCR |
0.031 |
|
0.199 |
|
0.440 |
0.000 |
0.329 |
0.000 |
0.000 |
|
| 1 spectrum, ALYSLVK |
0.000 |
|
0.281 |
|
0.132 |
0.379 |
0.068 |
0.141 |
0.000 |
|
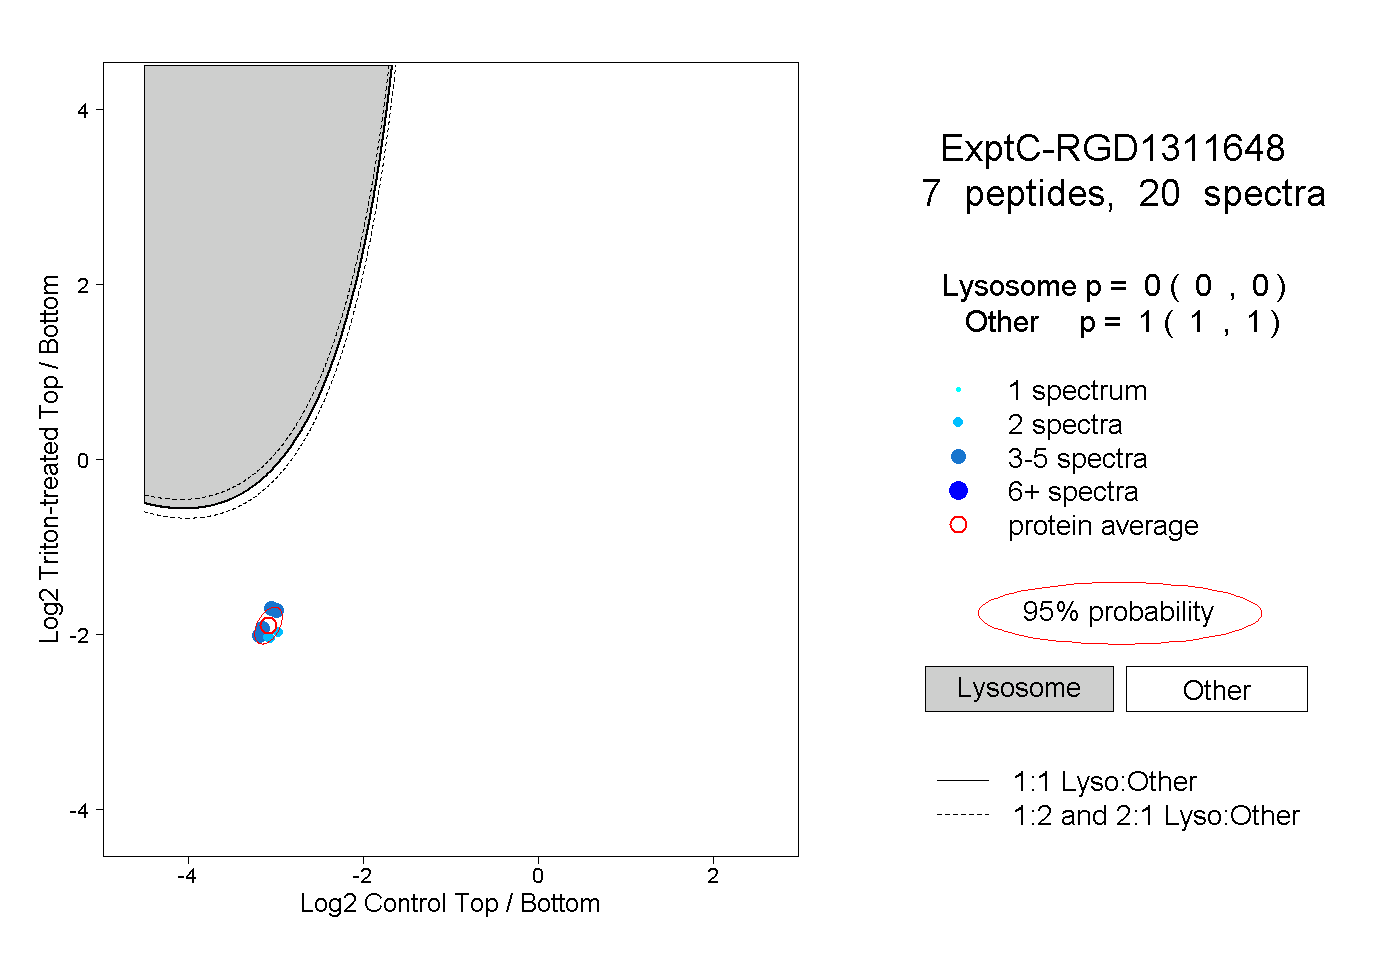
| | | Plot |
|
Lyso |
|
|
|
|
|
|
|
Other |
| Expt C |
7
peptides |
20
spectra |
 |
|
0.000
0.000 | 0.000 |
|
|
|
|
|
|
|
1.000
1.000 | 1.000 |