 5
5peptides
spectra
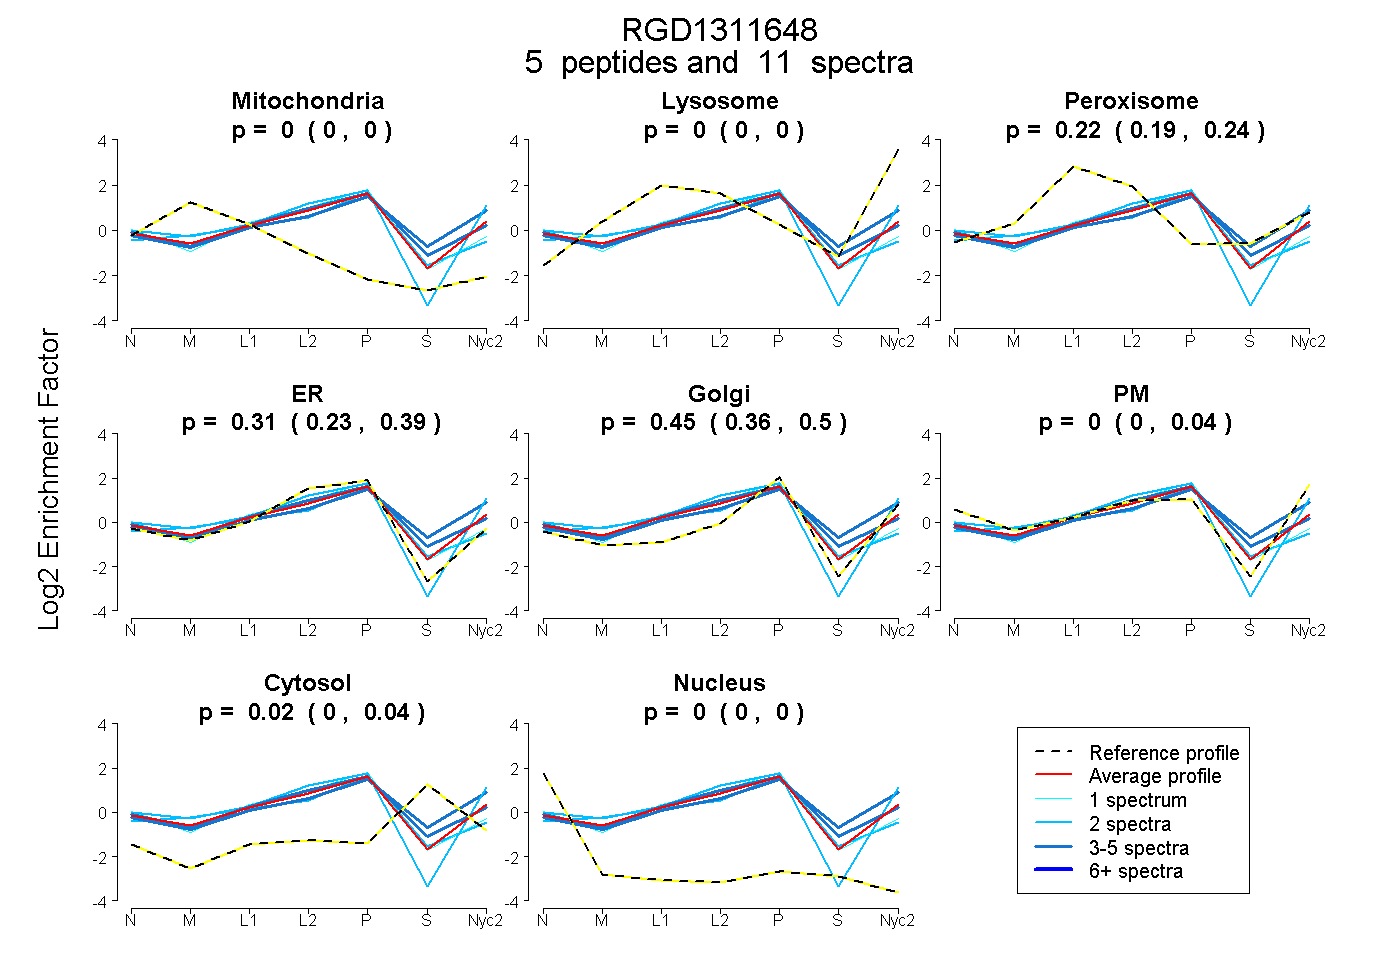
0.000 | 0.000
0.000 | 0.000
0.186 | 0.244
0.225 | 0.391
0.358 | 0.500
0.000 | 0.041
0.000 | 0.045
0.000 | 0.000
| Plot | Mito | Lyso | Perox | ER | Golgi | PM | Cytosol | Nucleus | |||||
| Expt A |
5 peptides |
11 spectra |
|
0.000 0.000 | 0.000 |
0.000 0.000 | 0.000 |
0.222 0.186 | 0.244 |
0.311 0.225 | 0.391 |
0.449 0.358 | 0.500 |
0.000 0.000 | 0.041 |
0.018 0.000 | 0.045 |
0.000 0.000 | 0.000 |
| 1 spectrum, APELPVVHTFLLFPTIER | 0.000 | 0.000 | 0.102 | 0.709 | 0.109 | 0.000 | 0.080 | 0.000 | ||
| 3 spectra, LTFYYGK | 0.000 | 0.000 | 0.224 | 0.388 | 0.294 | 0.000 | 0.093 | 0.000 | ||
| 3 spectra, DFPEANLHLCEK | 0.000 | 0.053 | 0.253 | 0.000 | 0.560 | 0.021 | 0.113 | 0.000 | ||
| 2 spectra, FATPFLCR | 0.000 | 0.000 | 0.000 | 0.427 | 0.000 | 0.573 | 0.000 | 0.000 | ||
| 2 spectra, ALYSLVK | 0.073 | 0.000 | 0.104 | 0.530 | 0.208 | 0.000 | 0.085 | 0.000 |
| Plot | Mito | Lyso or Perox | ER | Golgi | PM | Cytosol | Nucleus | ||||||
| Expt B |
3 peptides |
4 spectra |
 |
0.000 0.000 | 0.061 |
0.332 0.177 | 0.396 |
0.000 0.000 | 0.230 |
0.372 0.054 | 0.472 |
0.235 0.070 | 0.381 |
0.061 0.000 | 0.135 |
0.000 0.000 | 0.000 |
|||
| Plot | Lyso | Other | |||||||||||
| Expt C |
7 peptides |
20 spectra |
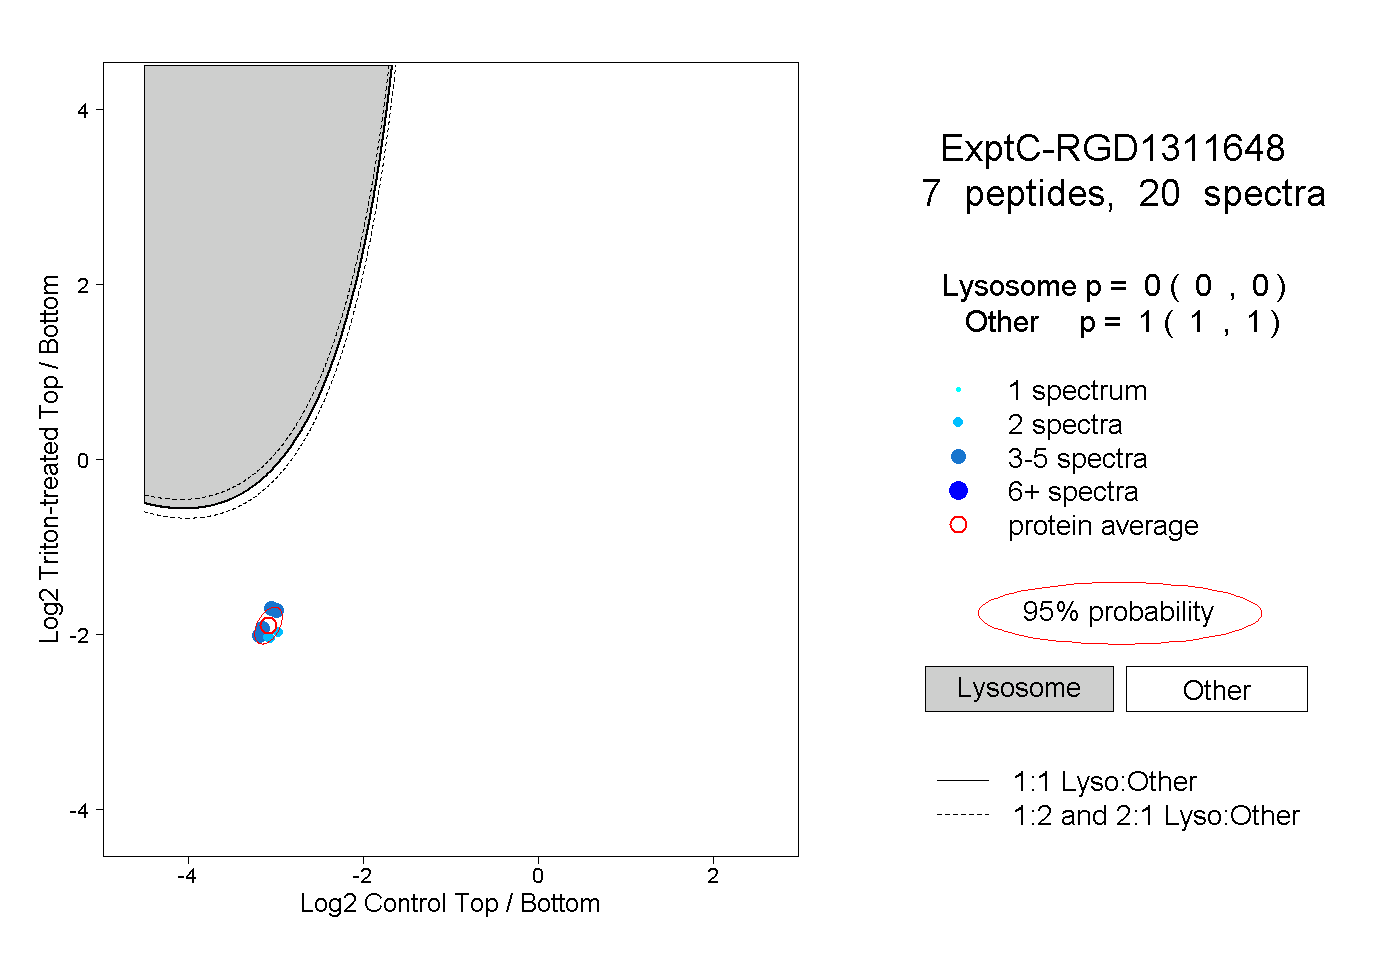 |
0.000 0.000 | 0.000 |
1.000 1.000 | 1.000 |