 3
3peptides
spectra
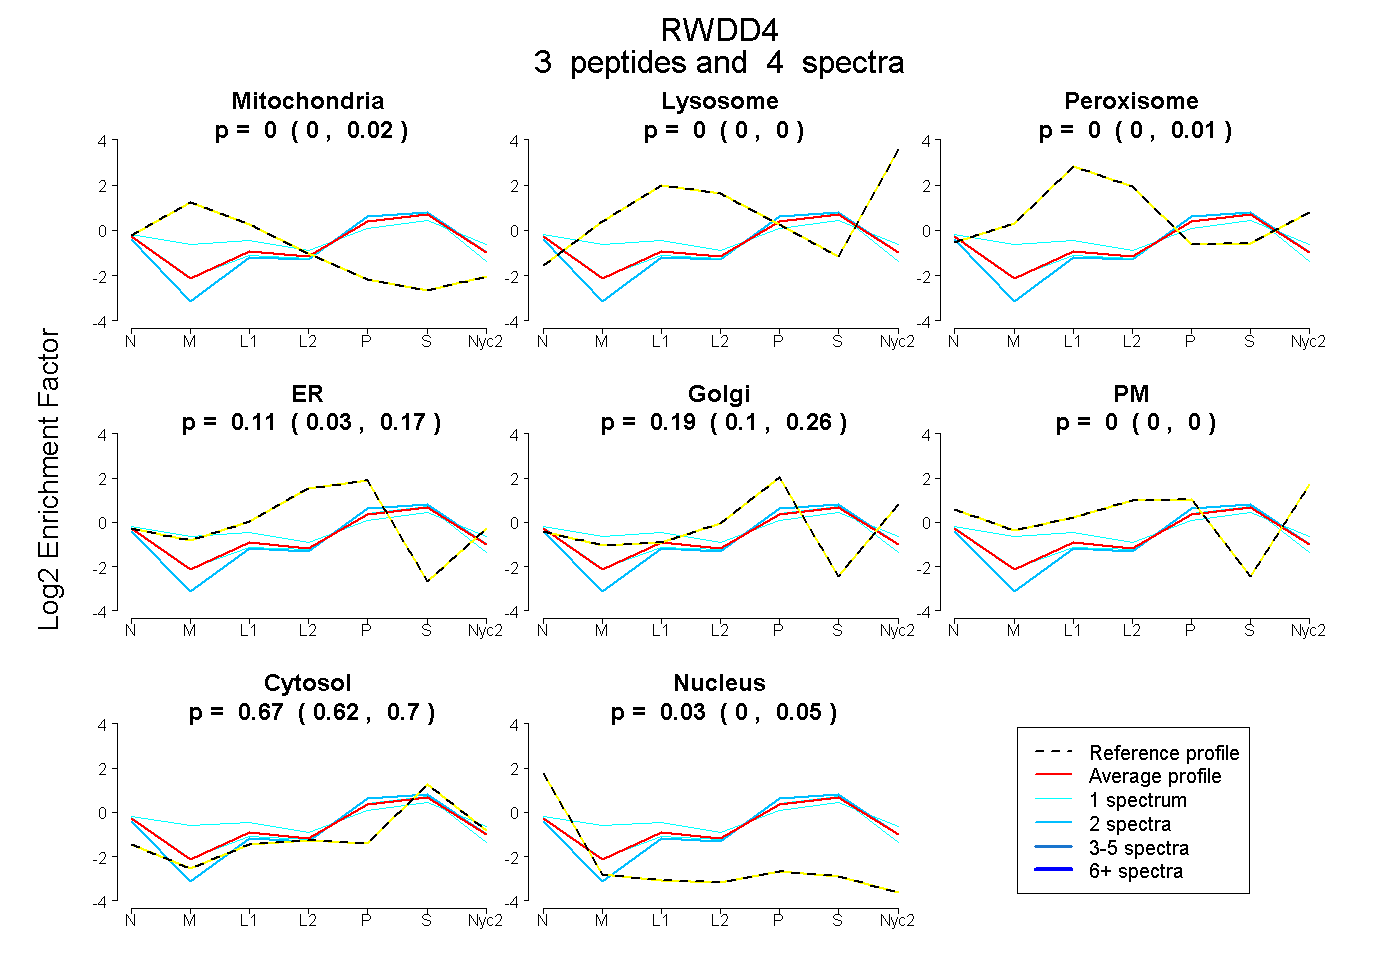
0.000 | 0.021
0.000 | 0.000
0.000 | 0.013
0.026 | 0.168
0.105 | 0.263
0.000 | 0.000
0.624 | 0.702
0.001 | 0.048
| Plot | Mito | Lyso | Perox | ER | Golgi | PM | Cytosol | Nucleus | |||||
| Expt A |
3 peptides |
4 spectra |
|
0.000 0.000 | 0.021 |
0.000 0.000 | 0.000 |
0.000 0.000 | 0.013 |
0.109 0.026 | 0.168 |
0.187 0.105 | 0.263 |
0.000 0.000 | 0.000 |
0.674 0.624 | 0.702 |
0.030 0.001 | 0.048 |
| 1 spectrum, SIYEGDESFR | 0.000 | 0.000 | 0.000 | 0.142 | 0.123 | 0.000 | 0.669 | 0.066 | ||
| 2 spectra, GWNWVDVVK | 0.000 | 0.000 | 0.000 | 0.000 | 0.253 | 0.000 | 0.717 | 0.030 | ||
| 1 spectrum, ELSPVSFQYR | 0.124 | 0.000 | 0.143 | 0.000 | 0.242 | 0.000 | 0.491 | 0.000 |
| Plot | Lyso | Other | |||||||||||
| Expt C |
2 peptides |
5 spectra |
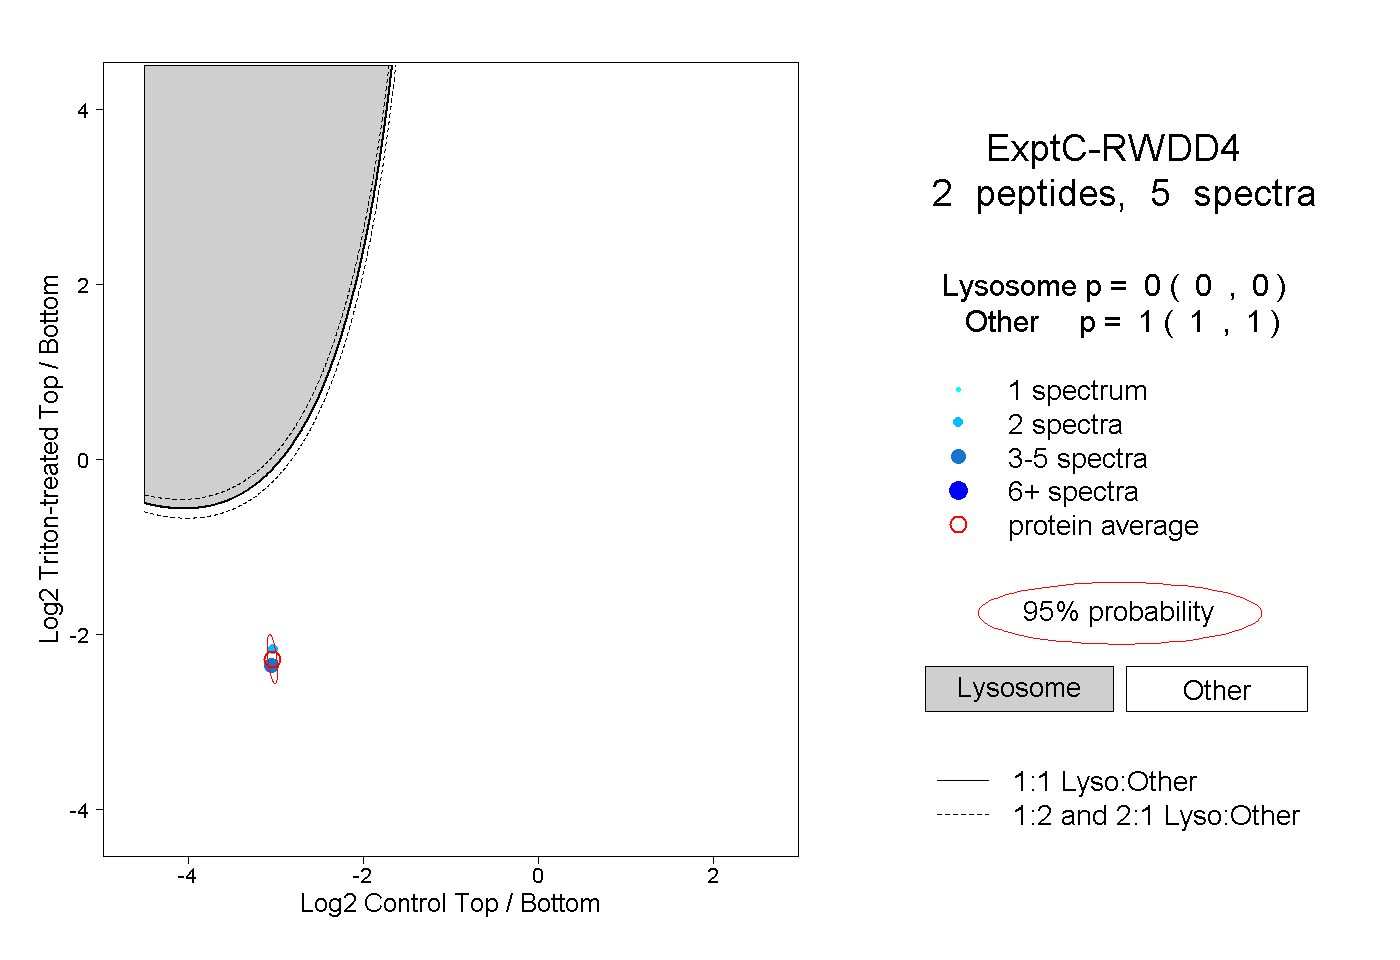 |
0.000 0.000 | 0.000 |
1.000 1.000 | 1.000 |