 4
4peptides
spectra
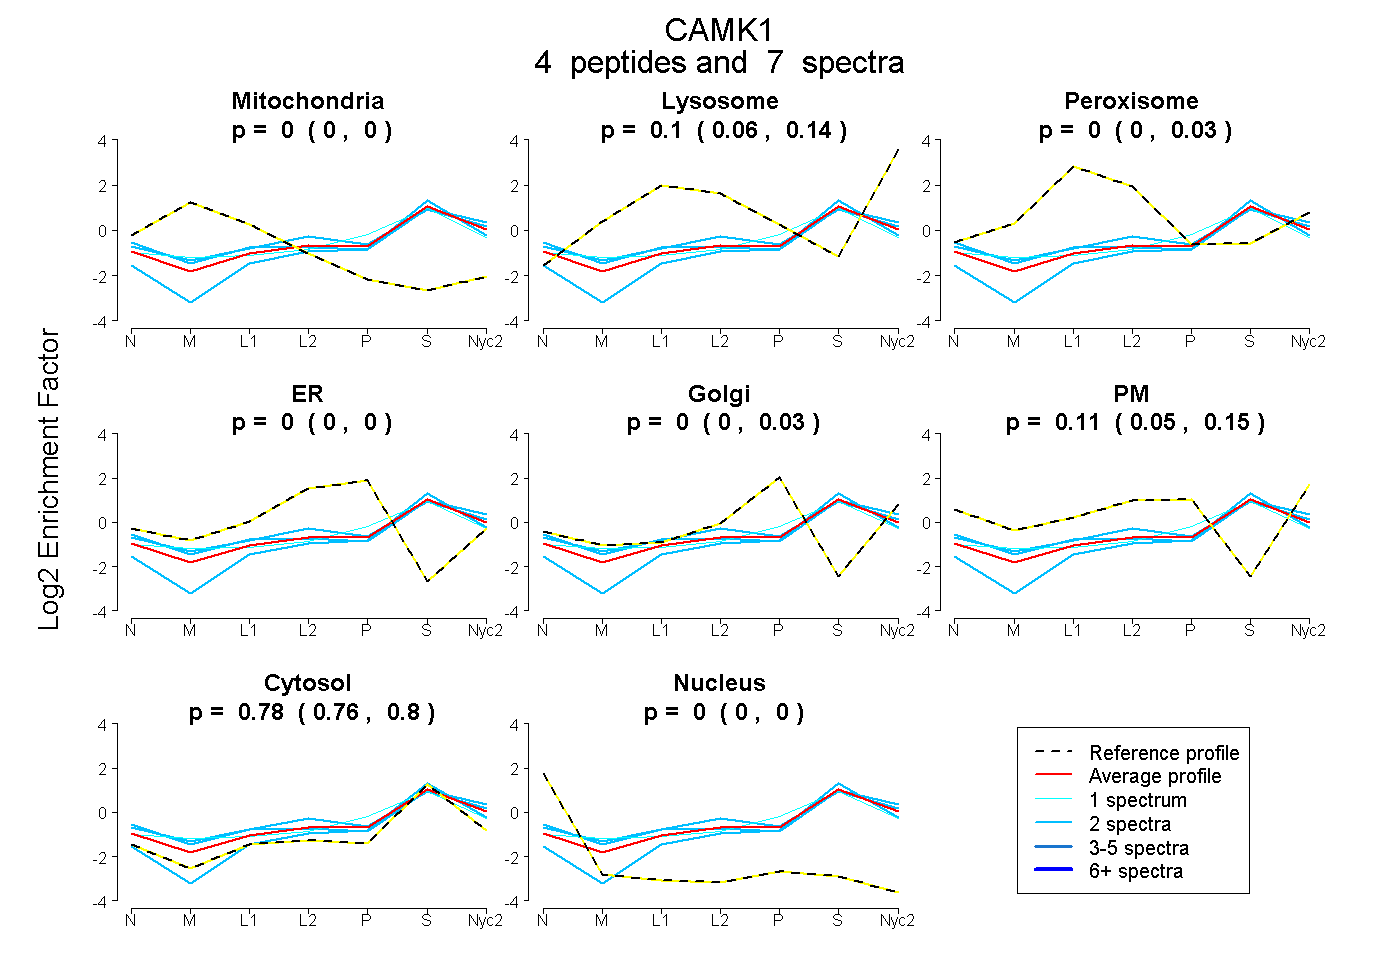
0.000 | 0.000
0.057 | 0.137
0.000 | 0.027
0.000 | 0.000
0.000 | 0.026
0.051 | 0.146
0.756 | 0.804
0.000 | 0.000
| Plot | Mito | Lyso | Perox | ER | Golgi | PM | Cytosol | Nucleus | |||||
| Expt A |
4 peptides |
7 spectra |
|
0.000 0.000 | 0.000 |
0.102 0.057 | 0.137 |
0.000 0.000 | 0.027 |
0.000 0.000 | 0.000 |
0.000 0.000 | 0.026 |
0.114 0.051 | 0.146 |
0.784 0.756 | 0.804 |
0.000 0.000 | 0.000 |
| 2 spectra, EGSMENEIAVLHK | 0.000 | 0.079 | 0.092 | 0.000 | 0.000 | 0.150 | 0.679 | 0.000 | ||
| 1 spectrum, YLHDLGIVHR | 0.000 | 0.032 | 0.076 | 0.000 | 0.198 | 0.000 | 0.695 | 0.000 | ||
| 2 spectra, QAFNATAVVR | 0.000 | 0.020 | 0.000 | 0.000 | 0.042 | 0.000 | 0.938 | 0.000 | ||
| 2 spectra, DIYDFR | 0.000 | 0.118 | 0.030 | 0.000 | 0.000 | 0.133 | 0.720 | 0.000 |
| Plot | Lyso | Other | |||||||||||
| Expt C |
3 peptides |
5 spectra |
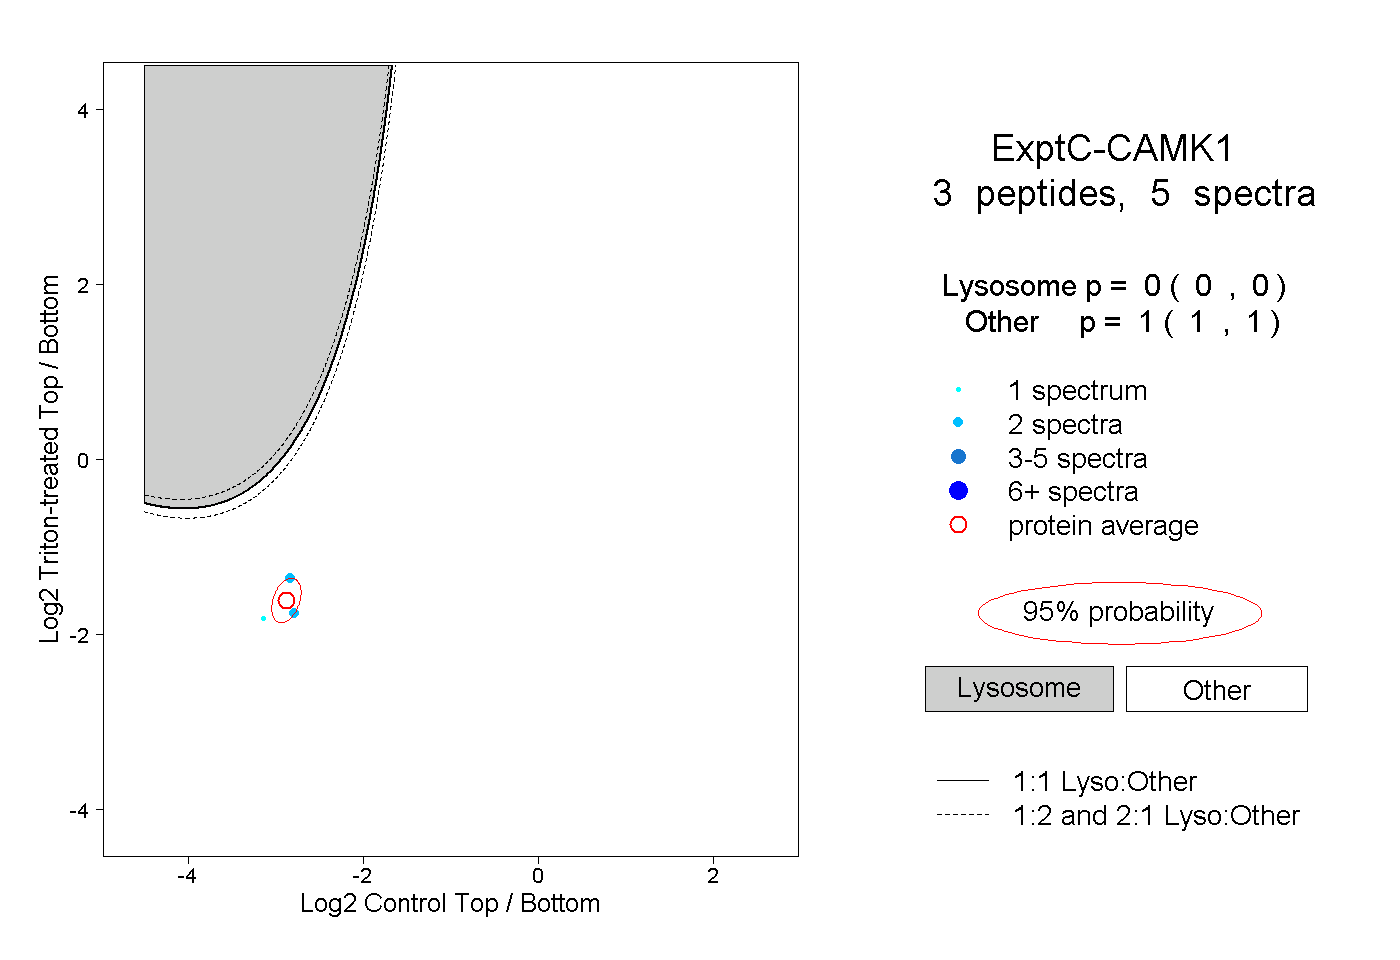 |
0.000 0.000 | 0.000 |
1.000 1.000 | 1.000 |