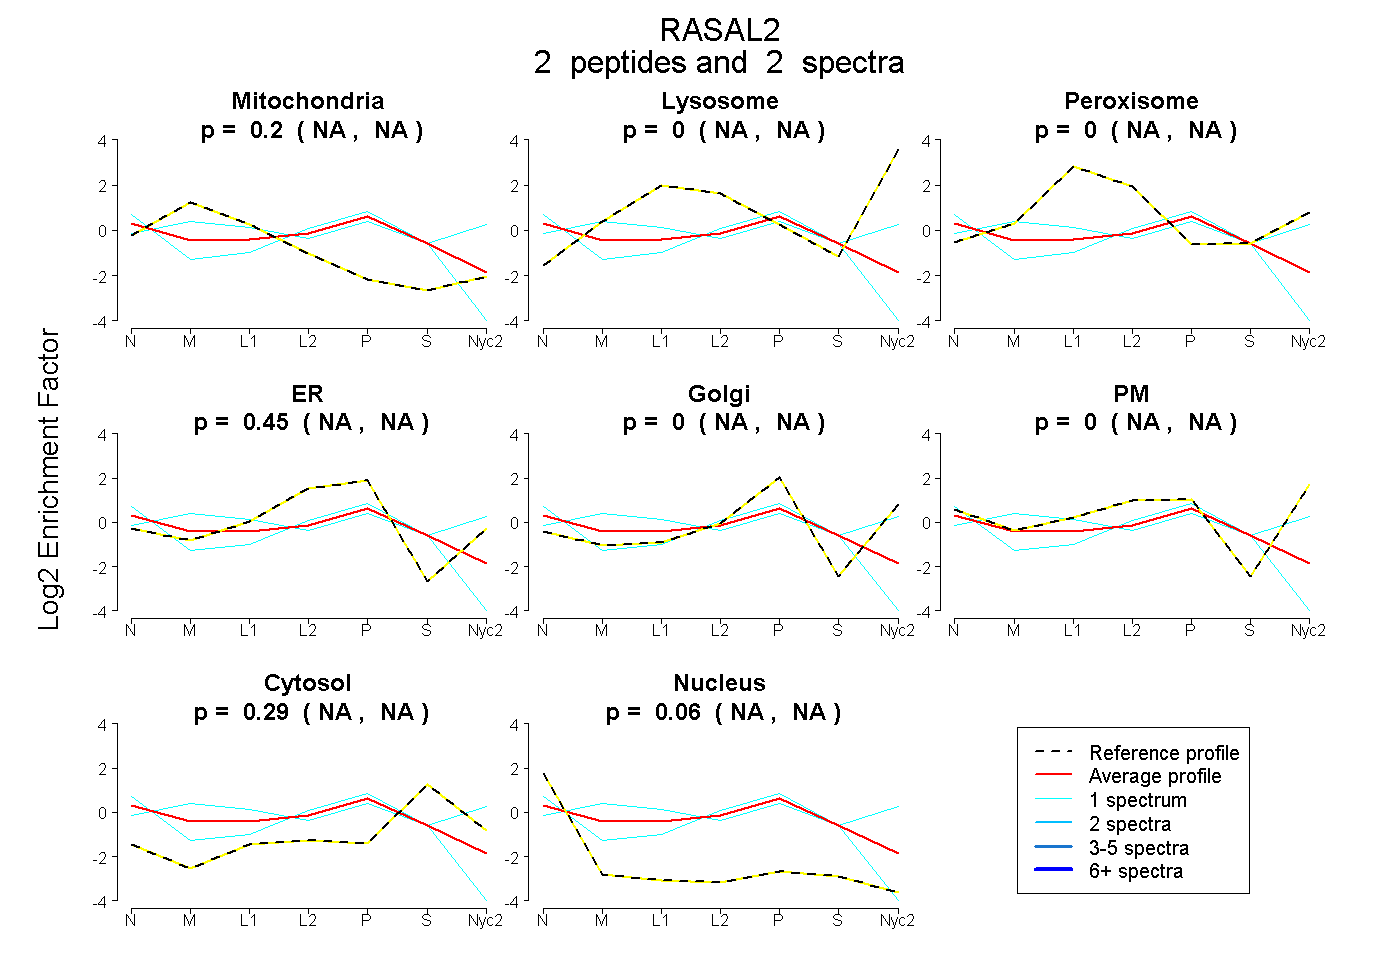
 2
2peptides
spectra
NA | NA
NA | NA
NA | NA
NA | NA
NA | NA
NA | NA
NA | NA
NA | NA
| Plot | Mito | Lyso | Perox | ER | Golgi | PM | Cytosol | Nucleus | |||||
| Expt A |
2 peptides |
2 spectra |
|
0.202 NA | NA |
0.000 NA | NA |
0.000 NA | NA |
0.452 NA | NA |
0.000 NA | NA |
0.000 NA | NA |
0.289 NA | NA |
0.057 NA | NA |
| 1 spectrum, SLTNPTPIQQQLR | 0.511 | 0.000 | 0.000 | 0.263 | 0.000 | 0.000 | 0.188 | 0.037 | ||
| 1 spectrum, LWIIEAK | 0.000 | 0.000 | 0.000 | 0.033 | 0.160 | 0.440 | 0.321 | 0.046 |
| Plot | Lyso | Other | |||||||||||
| Expt C |
2 peptides |
4 spectra |
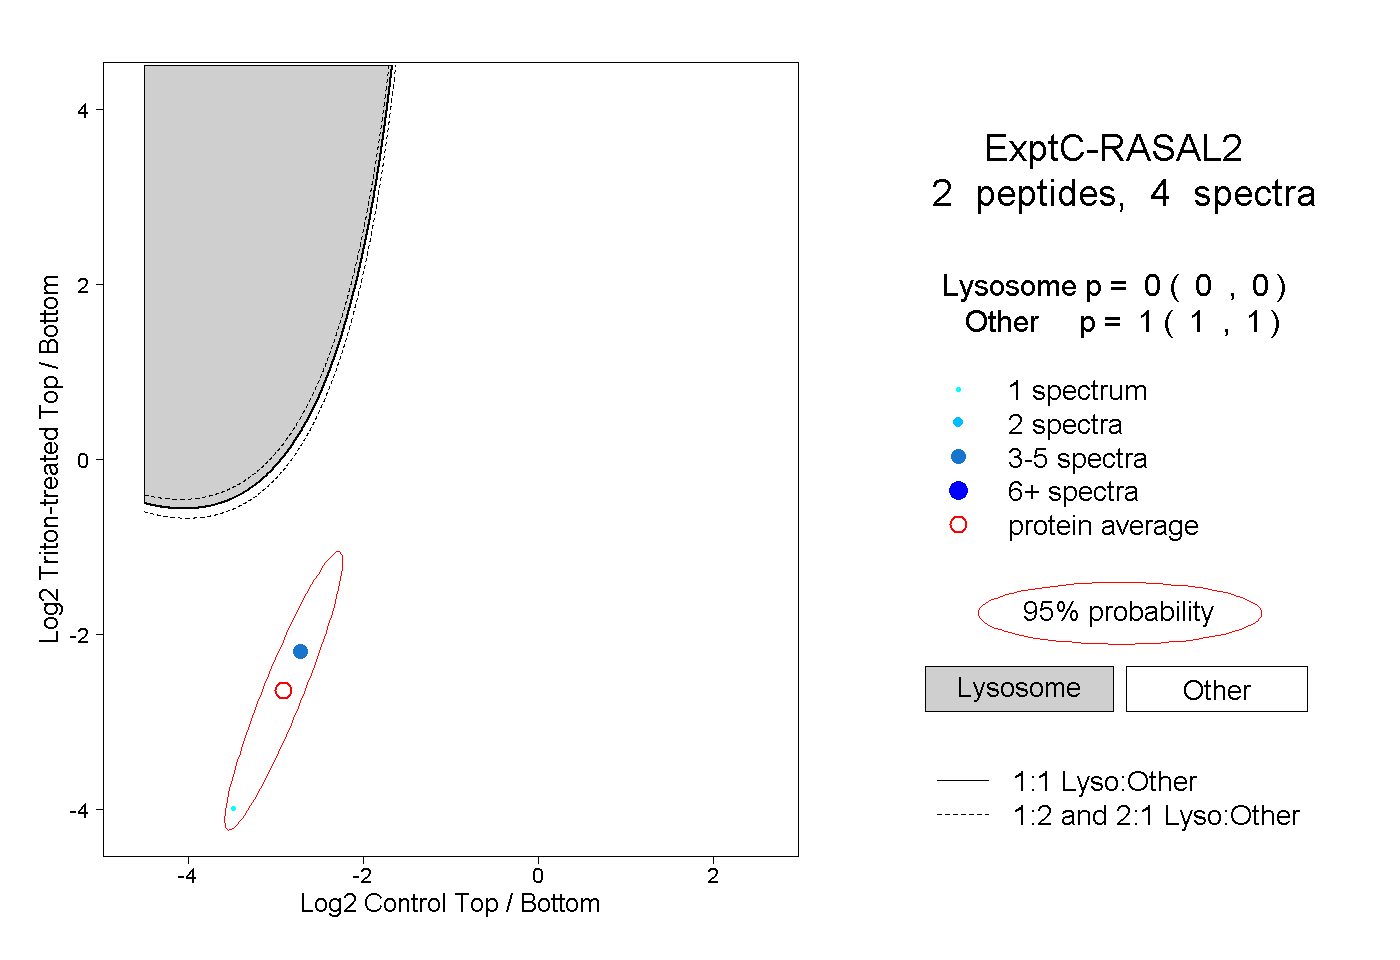 |
0.000 0.000 | 0.000 |
1.000 1.000 | 1.000 |