 65
65peptides
spectra

0.000 | 0.000
0.000 | 0.000
0.000 | 0.000
0.000 | 0.000
0.076 | 0.079
0.000 | 0.000
0.921 | 0.923
0.000 | 0.000
19peptides
spectra

0.000 | 0.000
0.000 | 0.000
0.000 | 0.000
0.074 | 0.084
0.000 | 0.000
0.915 | 0.925
0.000 | 0.000
52peptides
spectra

0.000 | 0.000
1.000 | 1.000
12peptides
spectra
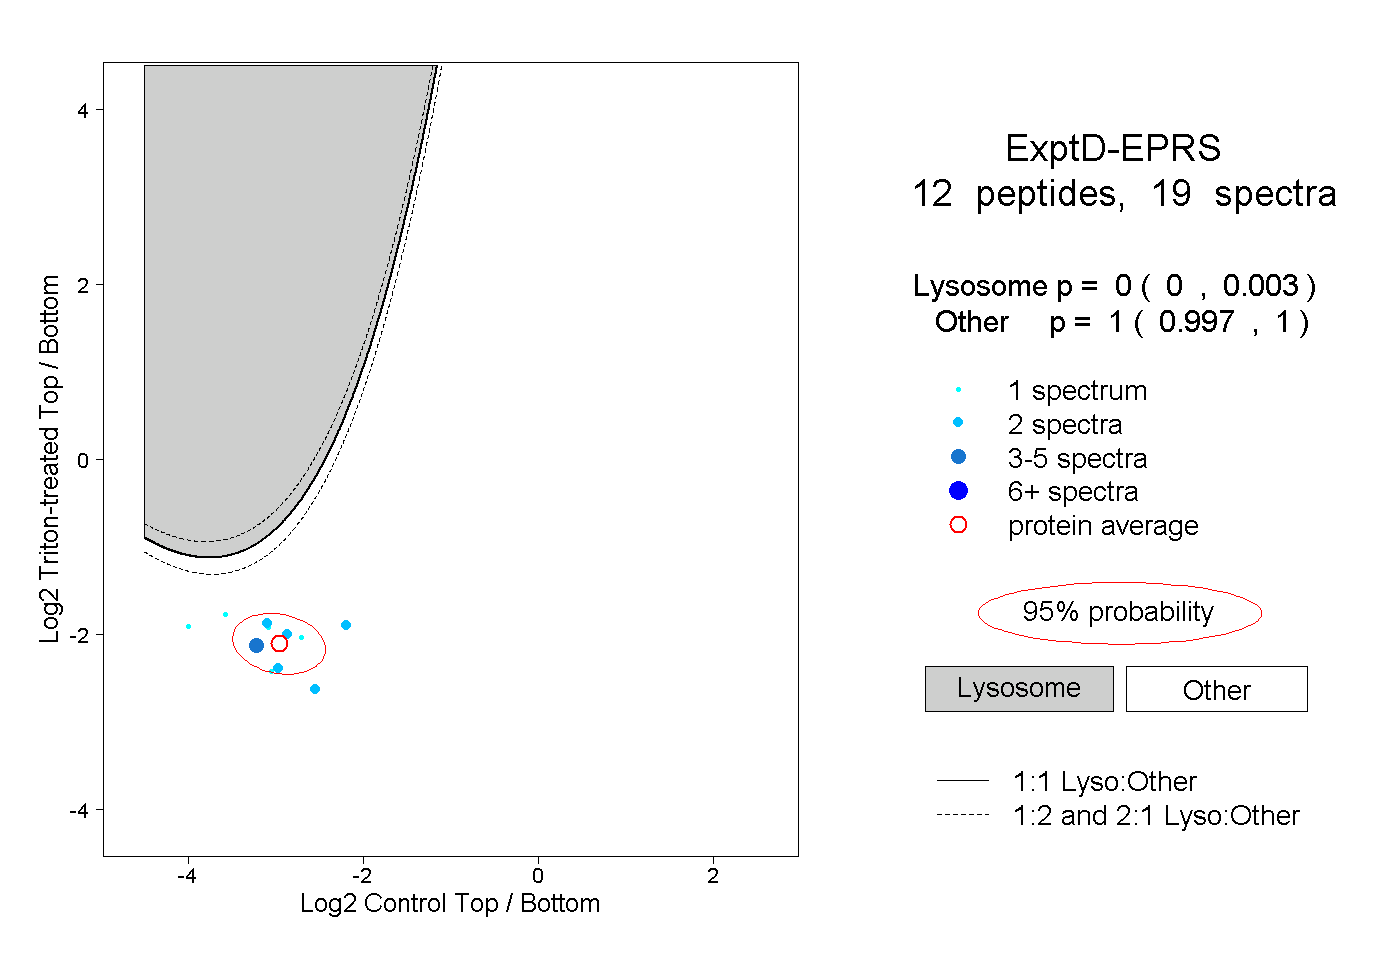
0.000 | 0.003
0.997 | 1.000