 6
6peptides
spectra
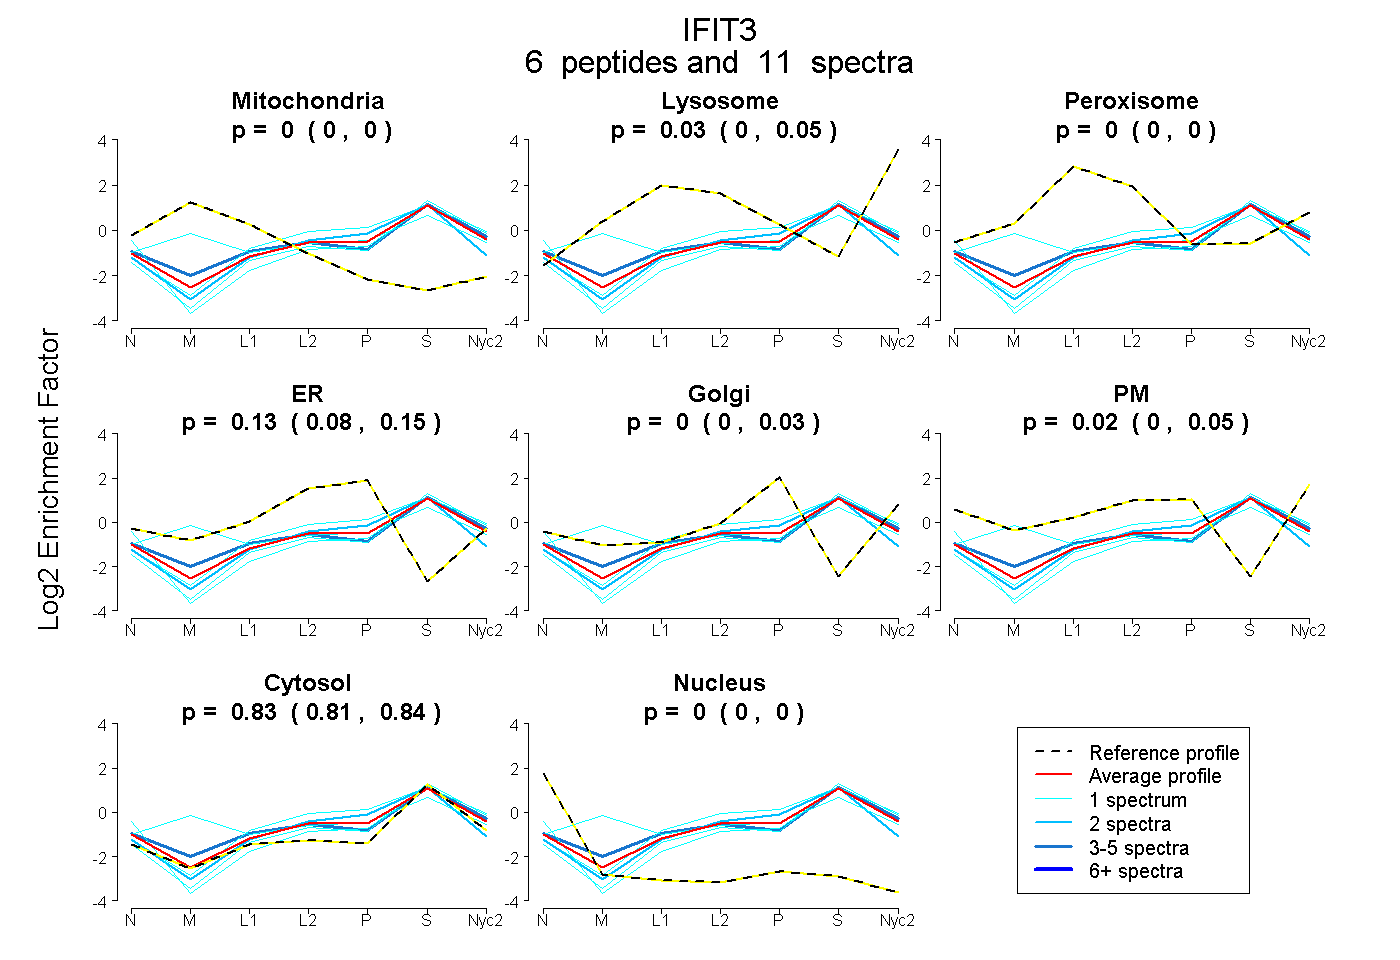
0.000 | 0.000
0.003 | 0.047
0.000 | 0.000
0.084 | 0.148
0.000 | 0.029
0.000 | 0.052
0.808 | 0.842
0.000 | 0.000
1peptide
spectra
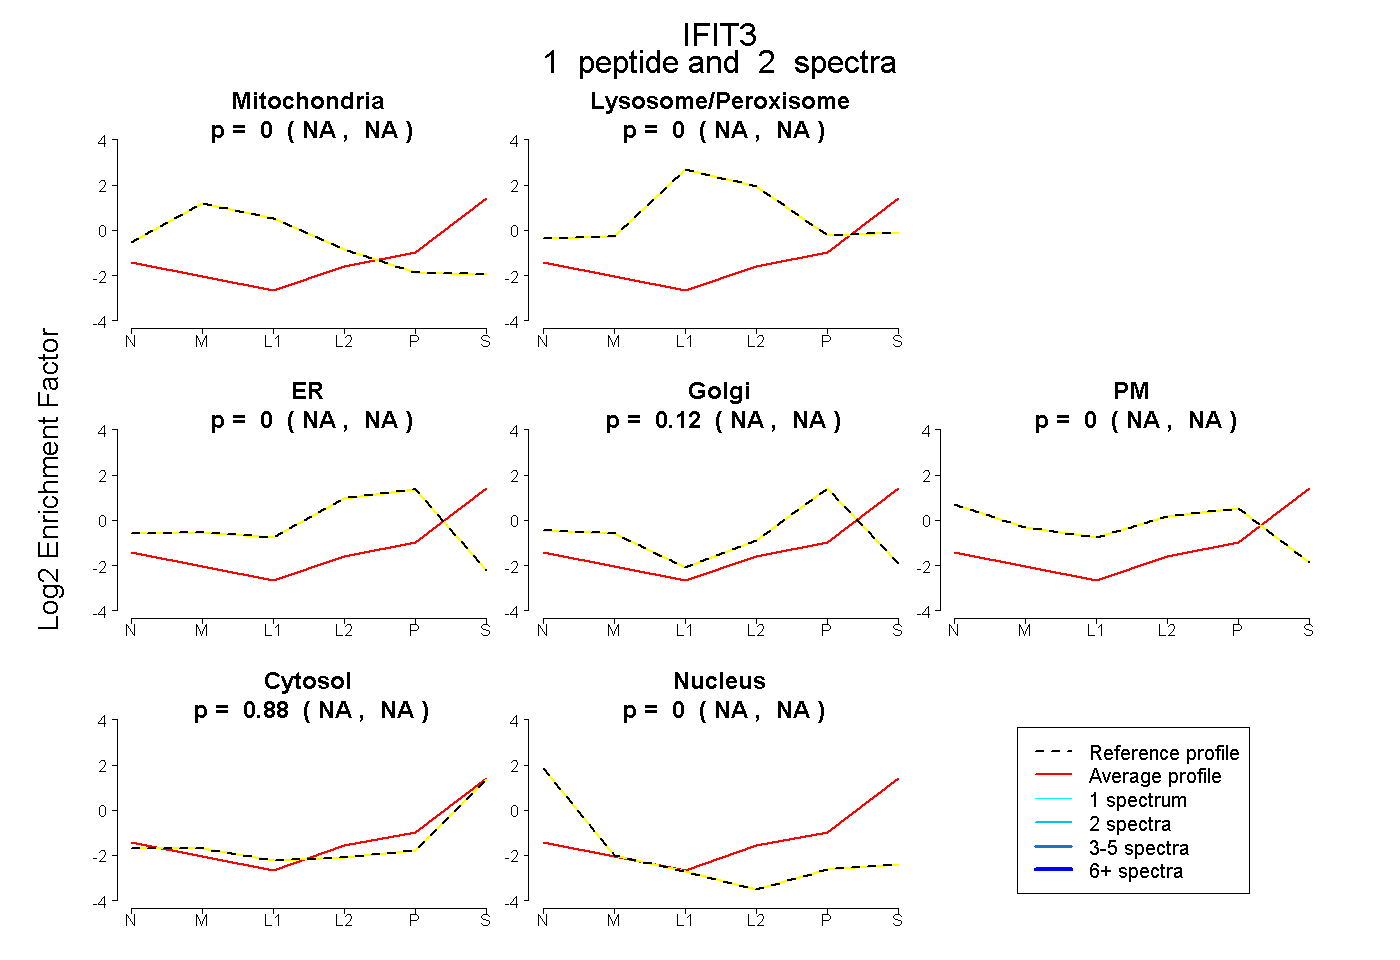
NA | NA
NA | NA
NA | NA
NA | NA
NA | NA
NA | NA
NA | NA
7peptides
spectra
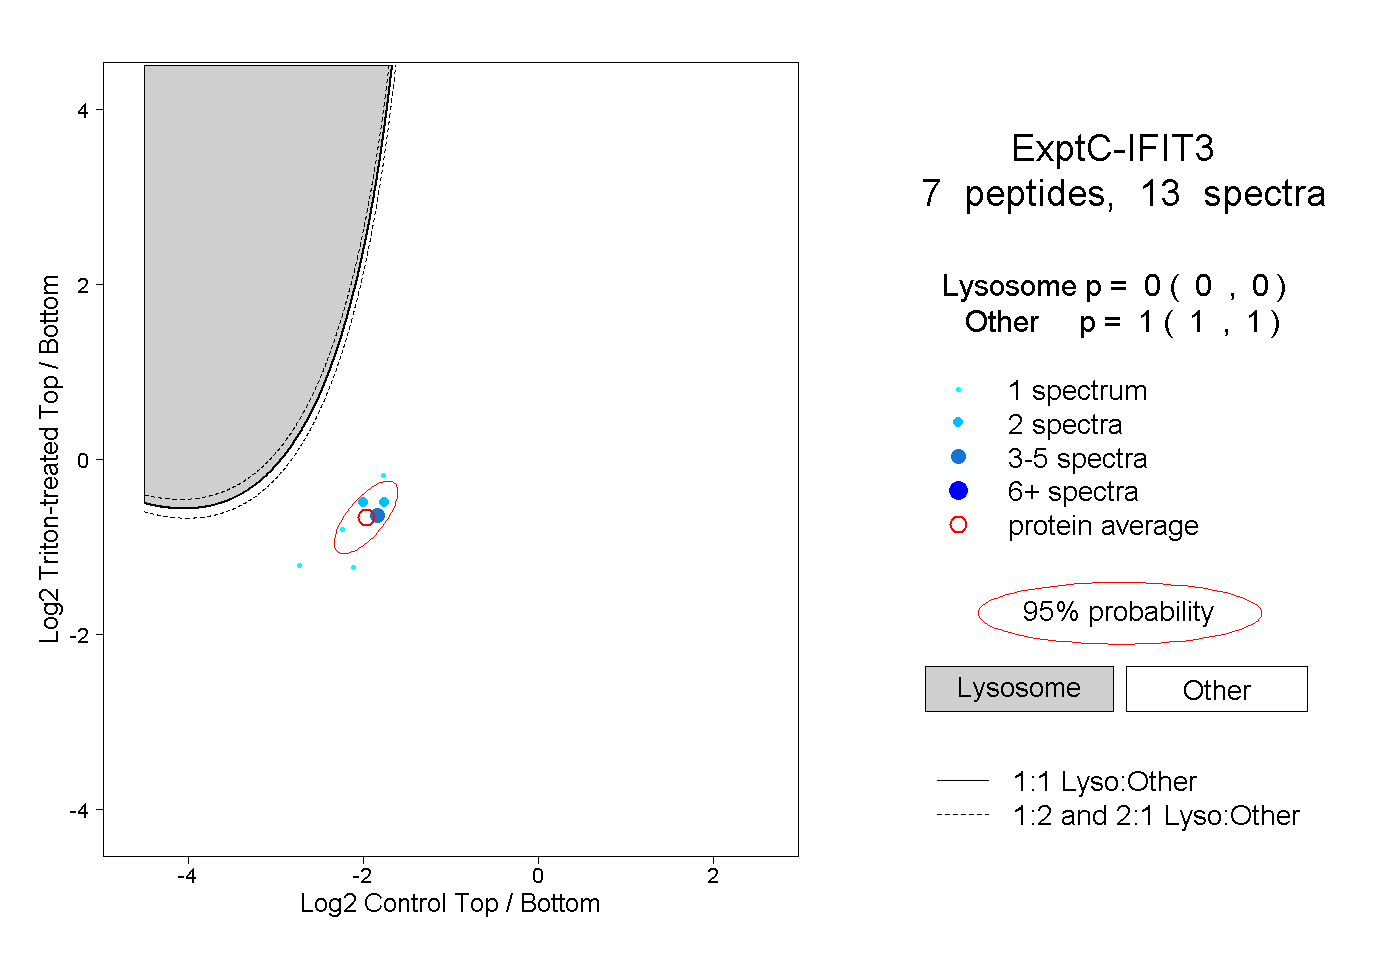
0.000 | 0.000
1.000 | 1.000
1peptide
spectrum
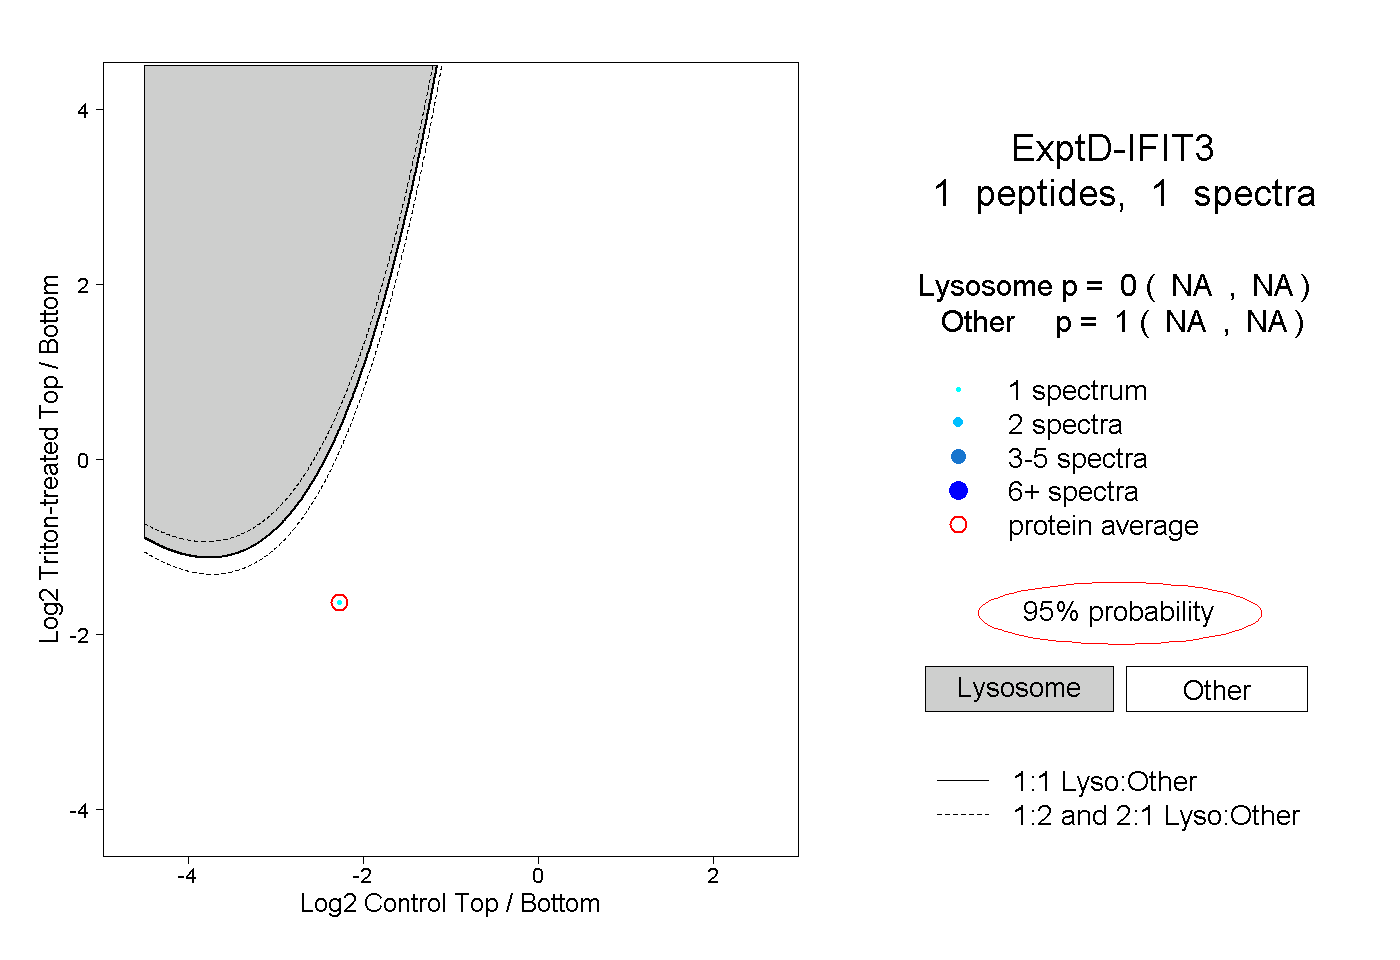
NA | NA
NA | NA