PEX11G
[ENSRNOP00000033197]
Main page
| | | Plot |
Mito |
Lyso |
|
Perox |
ER |
Golgi |
PM |
Cytosol |
Nucleus |
|
| Expt A |
 4
4
peptides |
8
spectra |
 |
0.000
0.000 | 0.000 |
0.243
0.184 | 0.296 |
|
0.738
0.662 | 0.788 |
0.019
0.000 | 0.060 |
0.000
0.000 | 0.000 |
0.000
0.000 | 0.000 |
0.000
0.000 | 0.000 |
0.000
0.000 | 0.000 |
|
| | | Plot |
Mito |
|
Lyso or Perox |
|
ER |
Golgi |
PM |
Cytosol |
Nucleus |
|
| Expt B |
3
peptides |
11
spectra |
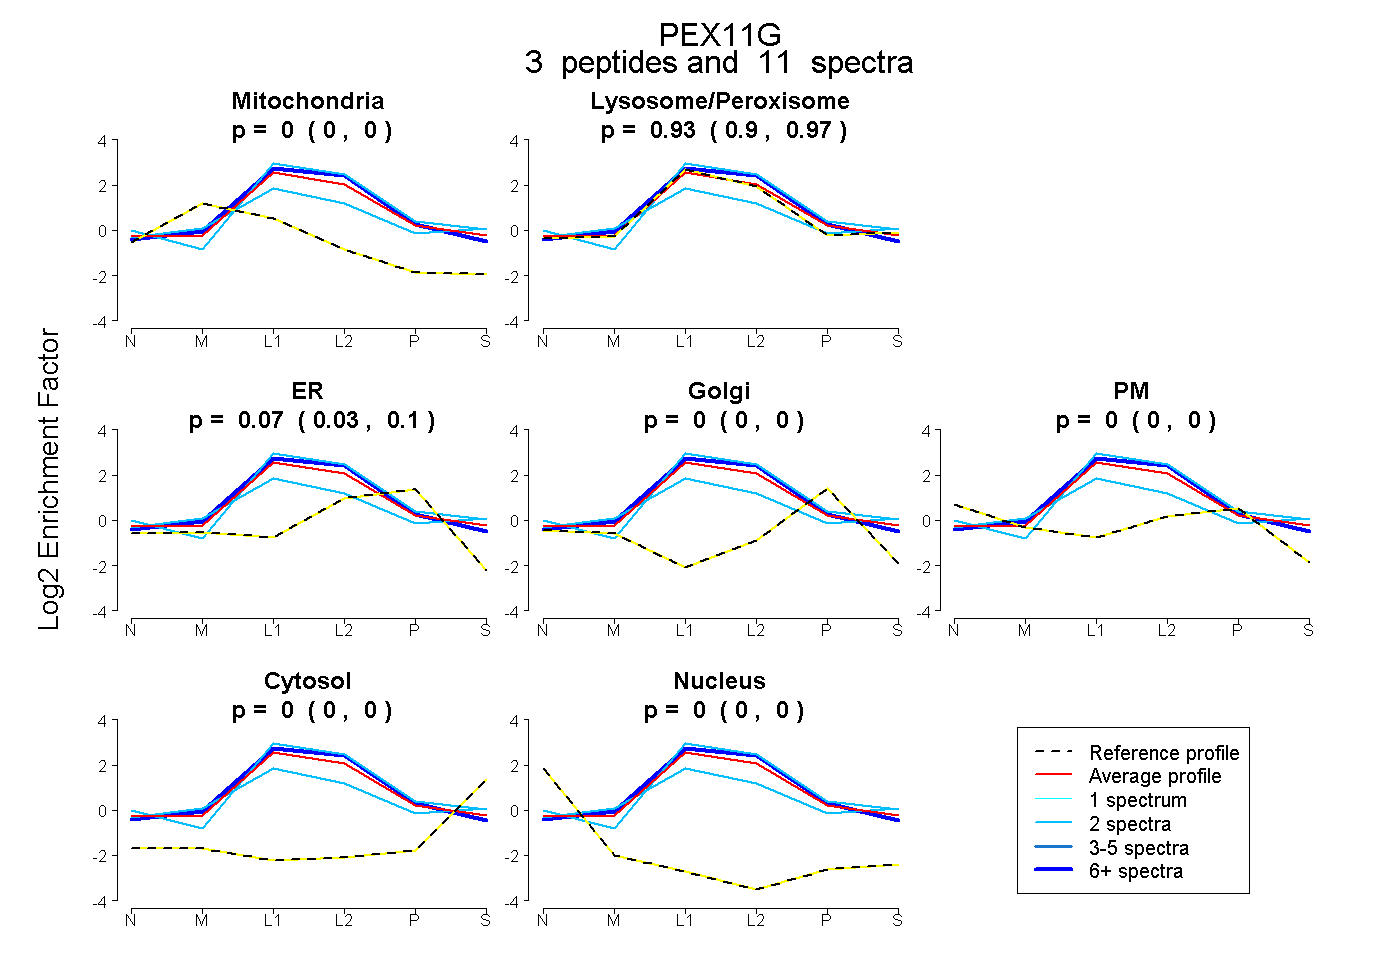 |
0.000
0.000 | 0.000 |
|
0.933
0.897 | 0.965 |
|
0.067
0.027 | 0.098 |
0.000
0.000 | 0.000 |
0.000
0.000 | 0.000 |
0.000
0.000 | 0.000 |
0.000
0.000 | 0.000 |
|
| 2 spectra, LLVVSAQLSHCR |
0.061 |
|
0.793 |
|
0.000 |
0.072 |
0.000 |
0.073 |
0.000 |
|
| 2 spectra, VLQVDSAR |
0.000 |
|
1.000 |
|
0.000 |
0.000 |
0.000 |
0.000 |
0.000 |
|
| 7 spectra, LFDDLAMFVYTK |
0.000 |
|
0.955 |
|
0.045 |
0.000 |
0.000 |
0.000 |
0.000 |
|
| | | Plot |
|
Lyso |
|
|
|
|
|
|
|
Other |
| Expt C |
5
peptides |
24
spectra |
 |
|
0.000
0.000 | 0.000 |
|
|
|
|
|
|
|
1.000
1.000 | 1.000 |
| | | Plot |
|
Lyso |
|
|
|
|
|
|
|
Other |
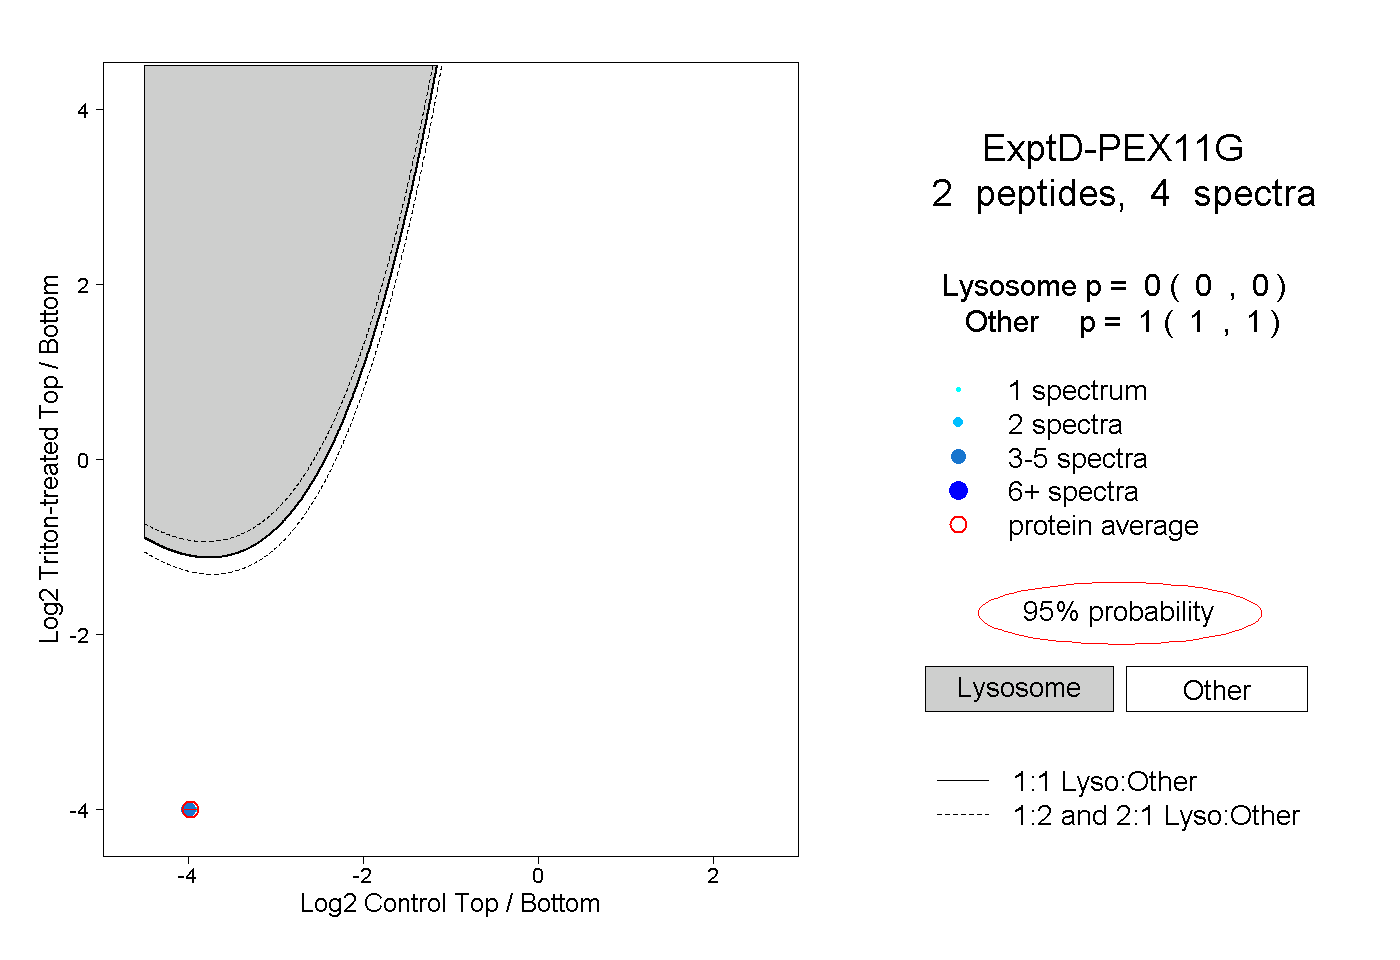
| Expt D |
2
peptides |
4
spectra |
 |
|
0.000
0.000 | 0.000 |
|
|
|
|
|
|
|
1.000
1.000 | 1.000 |