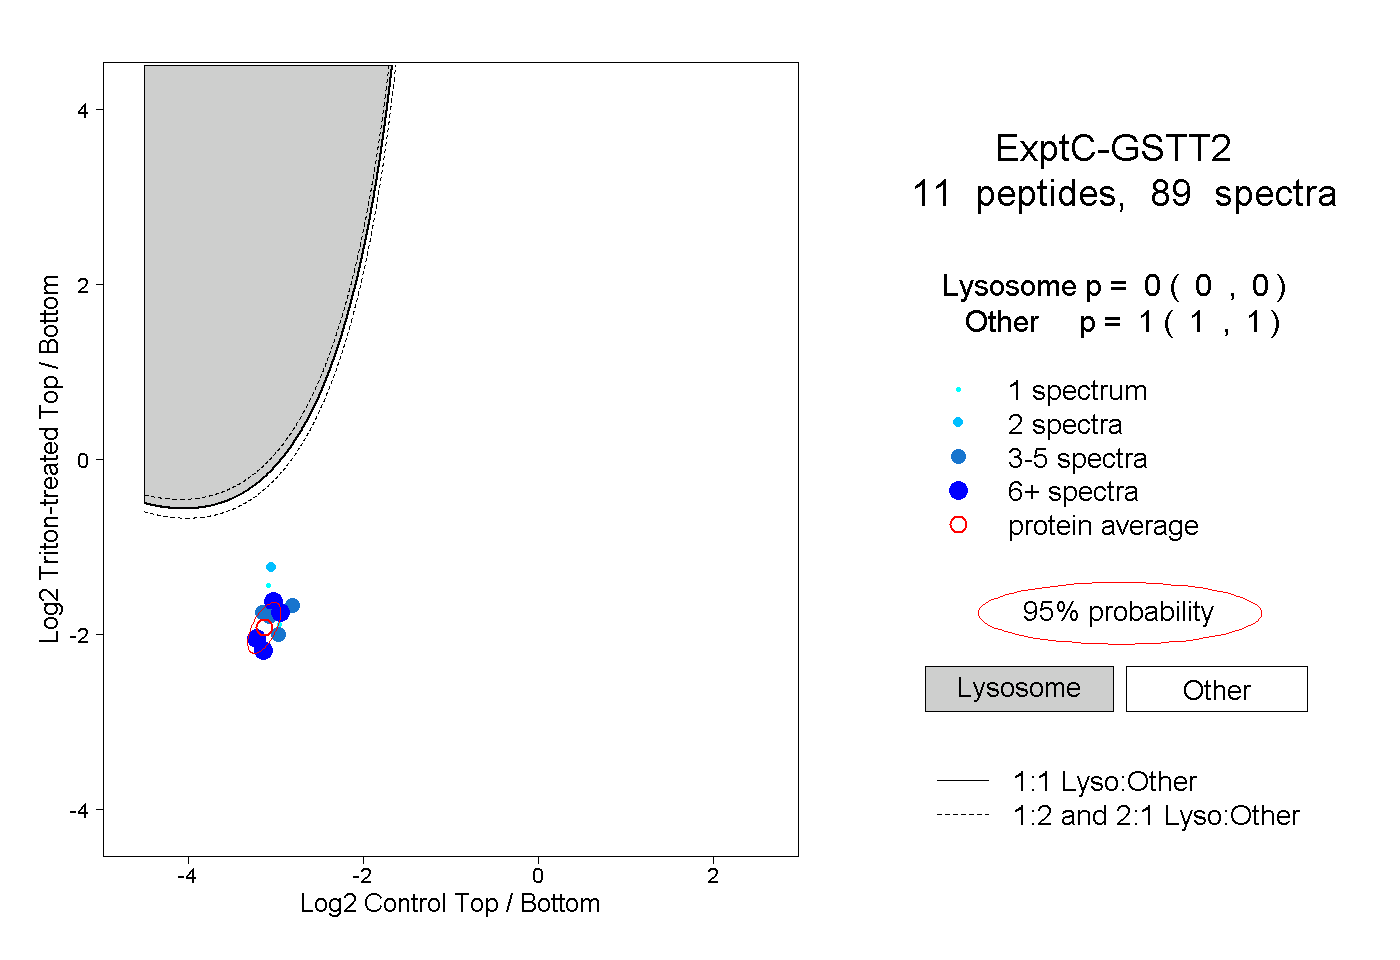
11
11peptides
spectra
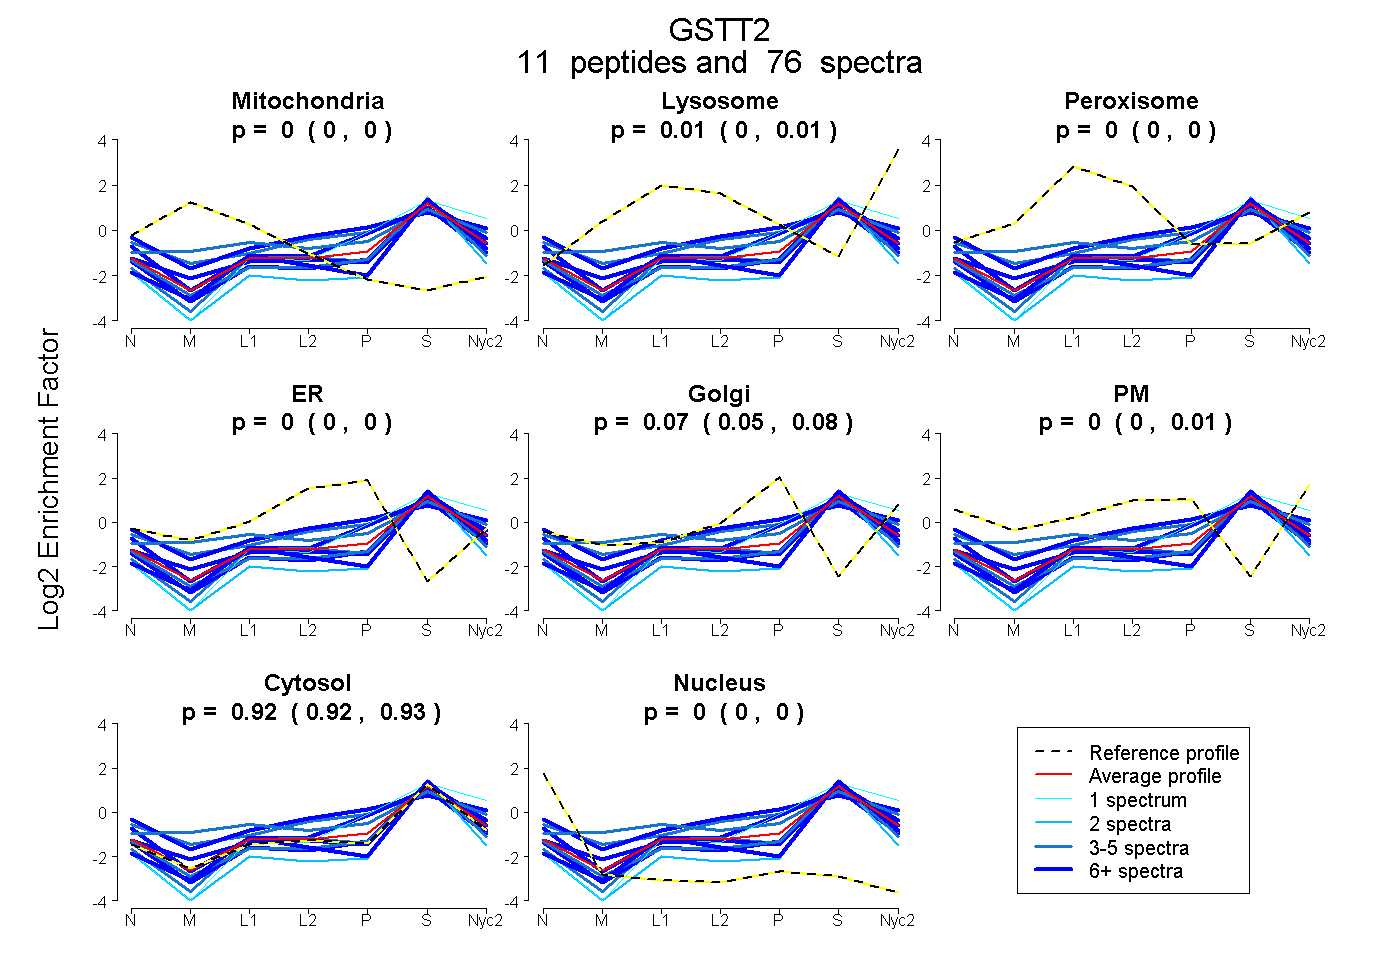
0.000 | 0.000
0.000 | 0.013
0.000 | 0.000
0.000 | 0.000
0.055 | 0.077
0.000 | 0.008
0.916 | 0.930
0.000 | 0.000
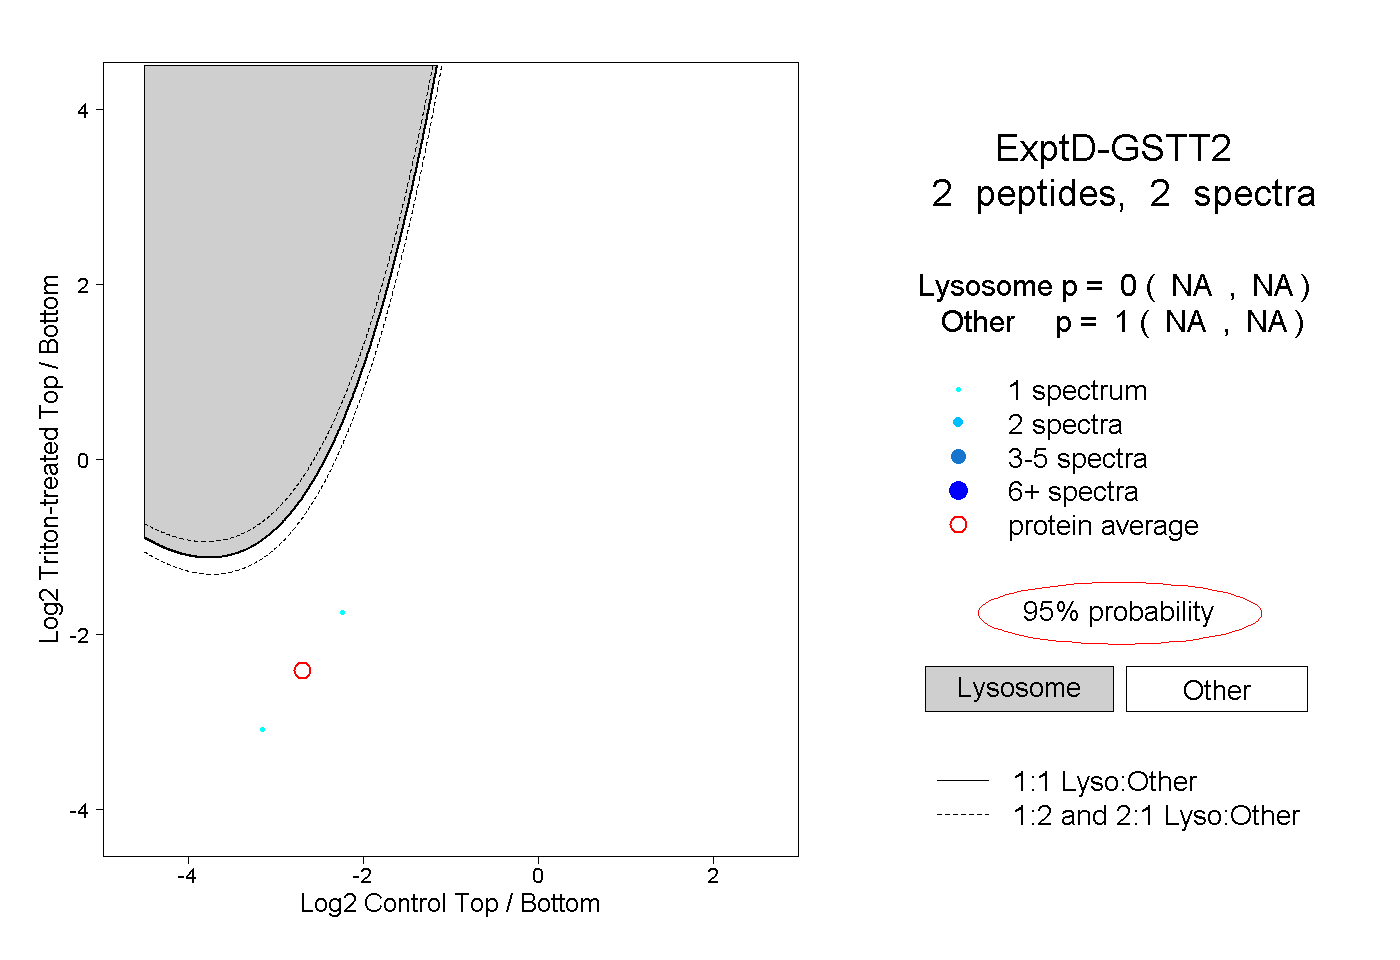
8peptides
spectra
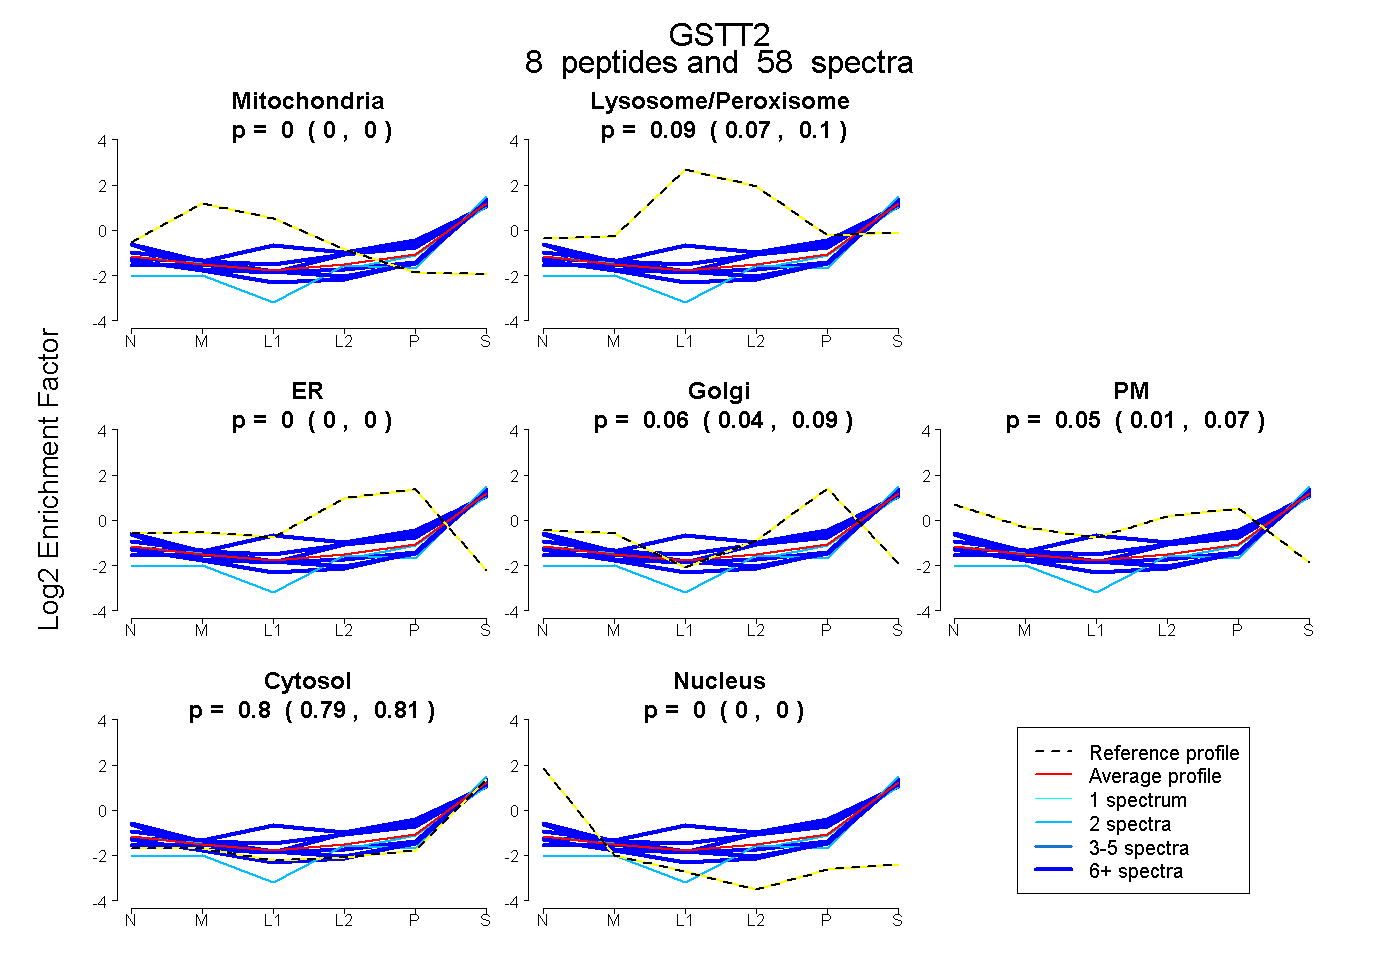
0.000 | 0.000
0.072 | 0.100
0.000 | 0.000
0.035 | 0.087
0.012 | 0.074
0.792 | 0.808
0.000 | 0.000