 11
11peptides
spectra
0.000 | 0.000
0.000 | 0.013
0.000 | 0.000
0.000 | 0.000
0.055 | 0.077
0.000 | 0.008
0.916 | 0.930
0.000 | 0.000
| Plot | Mito | Lyso | Perox | ER | Golgi | PM | Cytosol | Nucleus | |||||
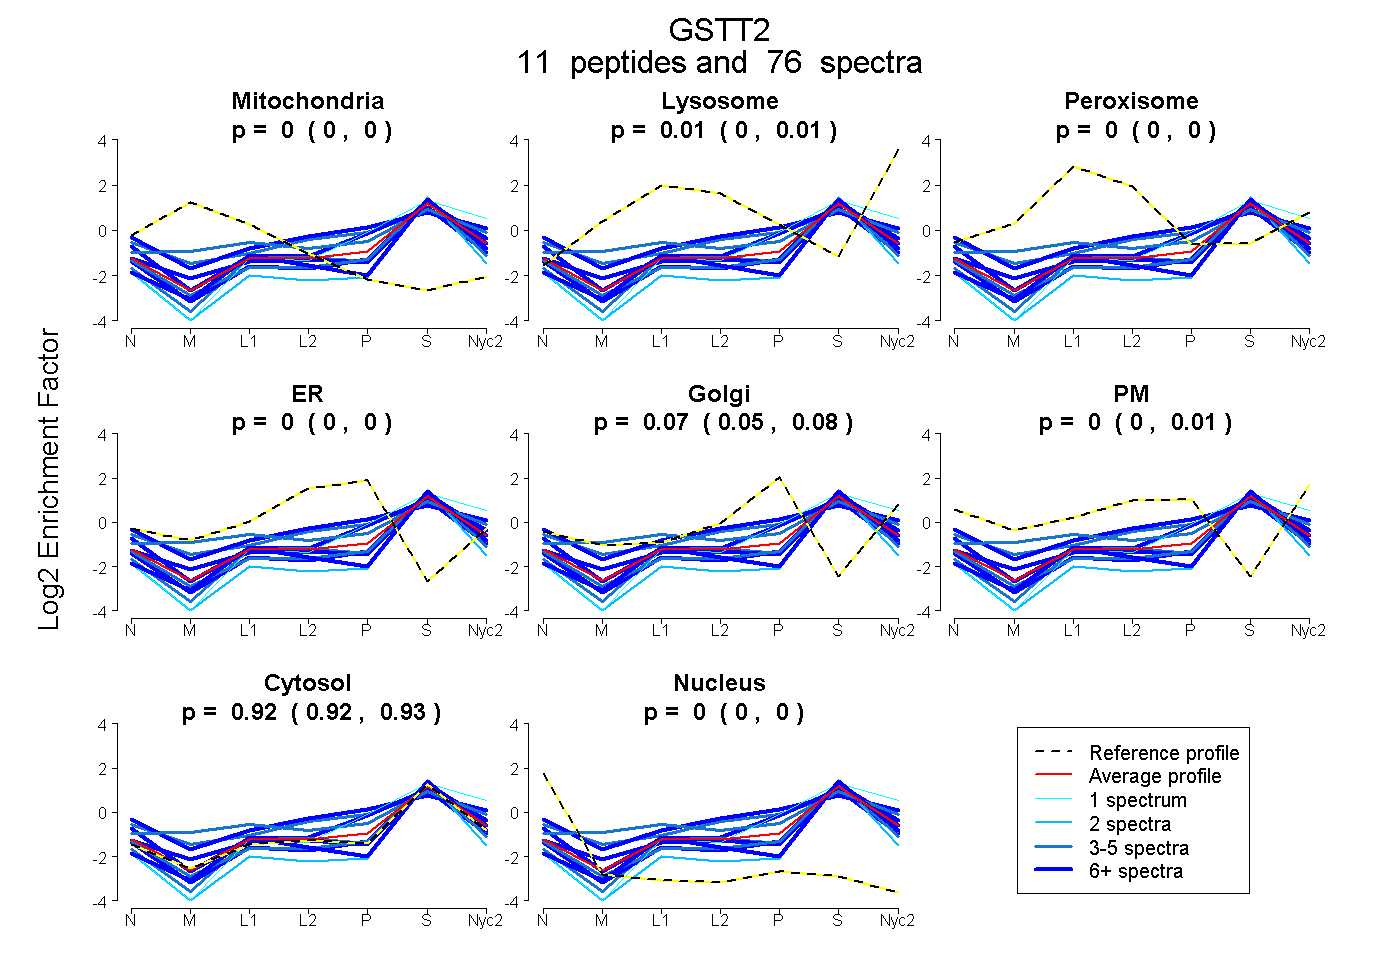
| Expt A |
11 peptides |
76 spectra |
|
0.000 0.000 | 0.000 |
0.007 0.000 | 0.013 |
0.000 0.000 | 0.000 |
0.000 0.000 | 0.000 |
0.069 0.055 | 0.077 |
0.000 0.000 | 0.008 |
0.924 0.916 | 0.930 |
0.000 0.000 | 0.000 |
| 16 spectra, AVYIFAK | 0.000 | 0.000 | 0.000 | 0.061 | 0.111 | 0.000 | 0.819 | 0.009 | ||
| 16 spectra, NSMVLALQR | 0.006 | 0.059 | 0.000 | 0.000 | 0.000 | 0.000 | 0.935 | 0.000 | ||
| 10 spectra, GTFGVLLWTK | 0.000 | 0.000 | 0.000 | 0.000 | 0.000 | 0.000 | 0.992 | 0.008 | ||
| 3 spectra, TLPVPPPEAHASMMLR | 0.047 | 0.109 | 0.117 | 0.000 | 0.073 | 0.000 | 0.654 | 0.000 | ||
| 9 spectra, YQVADHWYPADLQAR | 0.000 | 0.000 | 0.000 | 0.000 | 0.000 | 0.000 | 1.000 | 0.000 | ||
| 1 spectrum, VLGPLIGVQVPEEK | 0.000 | 0.023 | 0.000 | 0.000 | 0.094 | 0.000 | 0.882 | 0.000 | ||
| 3 spectra, GQHLSEQFSQVNCLK | 0.000 | 0.000 | 0.000 | 0.000 | 0.000 | 0.000 | 1.000 | 0.000 | ||
| 8 spectra, NGIPFQLR | 0.000 | 0.000 | 0.045 | 0.000 | 0.052 | 0.274 | 0.629 | 0.000 | ||
| 3 spectra, AQVHEYLGWHADNIR | 0.000 | 0.000 | 0.059 | 0.072 | 0.068 | 0.126 | 0.675 | 0.000 | ||
| 2 spectra, GLELYLDLLSQPSR | 0.000 | 0.000 | 0.000 | 0.000 | 0.000 | 0.000 | 0.919 | 0.081 | ||
| 5 spectra, TVDLLK | 0.000 | 0.000 | 0.000 | 0.000 | 0.000 | 0.000 | 0.972 | 0.028 |
| Plot | Mito | Lyso or Perox | ER | Golgi | PM | Cytosol | Nucleus | ||||||
| Expt B |
8 peptides |
58 spectra |
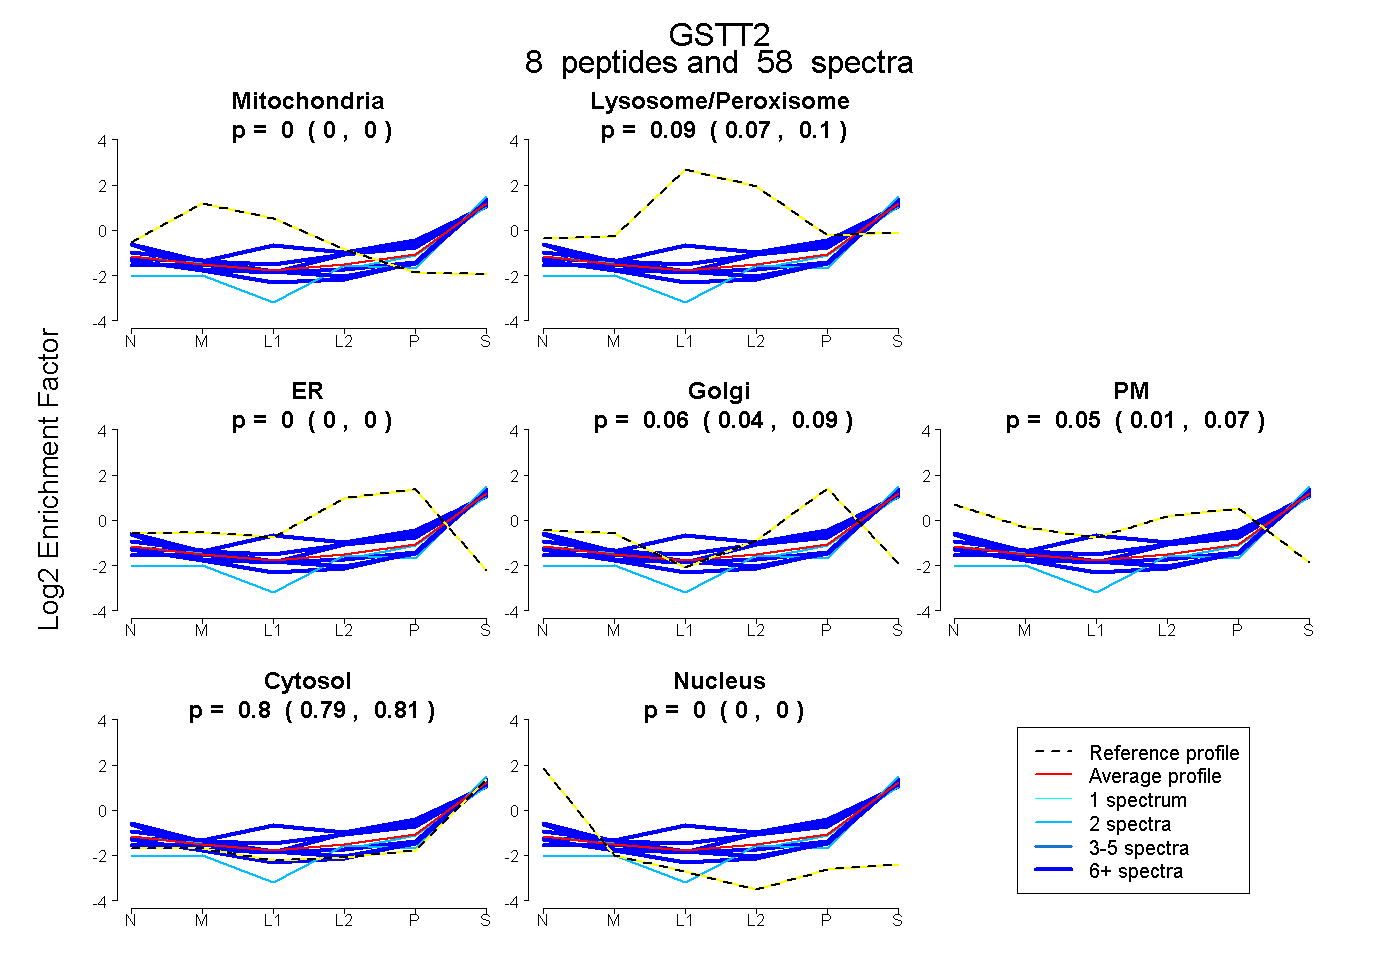 |
0.000 0.000 | 0.000 |
0.087 0.072 | 0.100 |
0.000 0.000 | 0.000 |
0.065 0.035 | 0.087 |
0.047 0.012 | 0.074 |
0.800 0.792 | 0.808 |
0.000 0.000 | 0.000 |
|||
| Plot | Lyso | Other | |||||||||||
| Expt C |
11 peptides |
89 spectra |
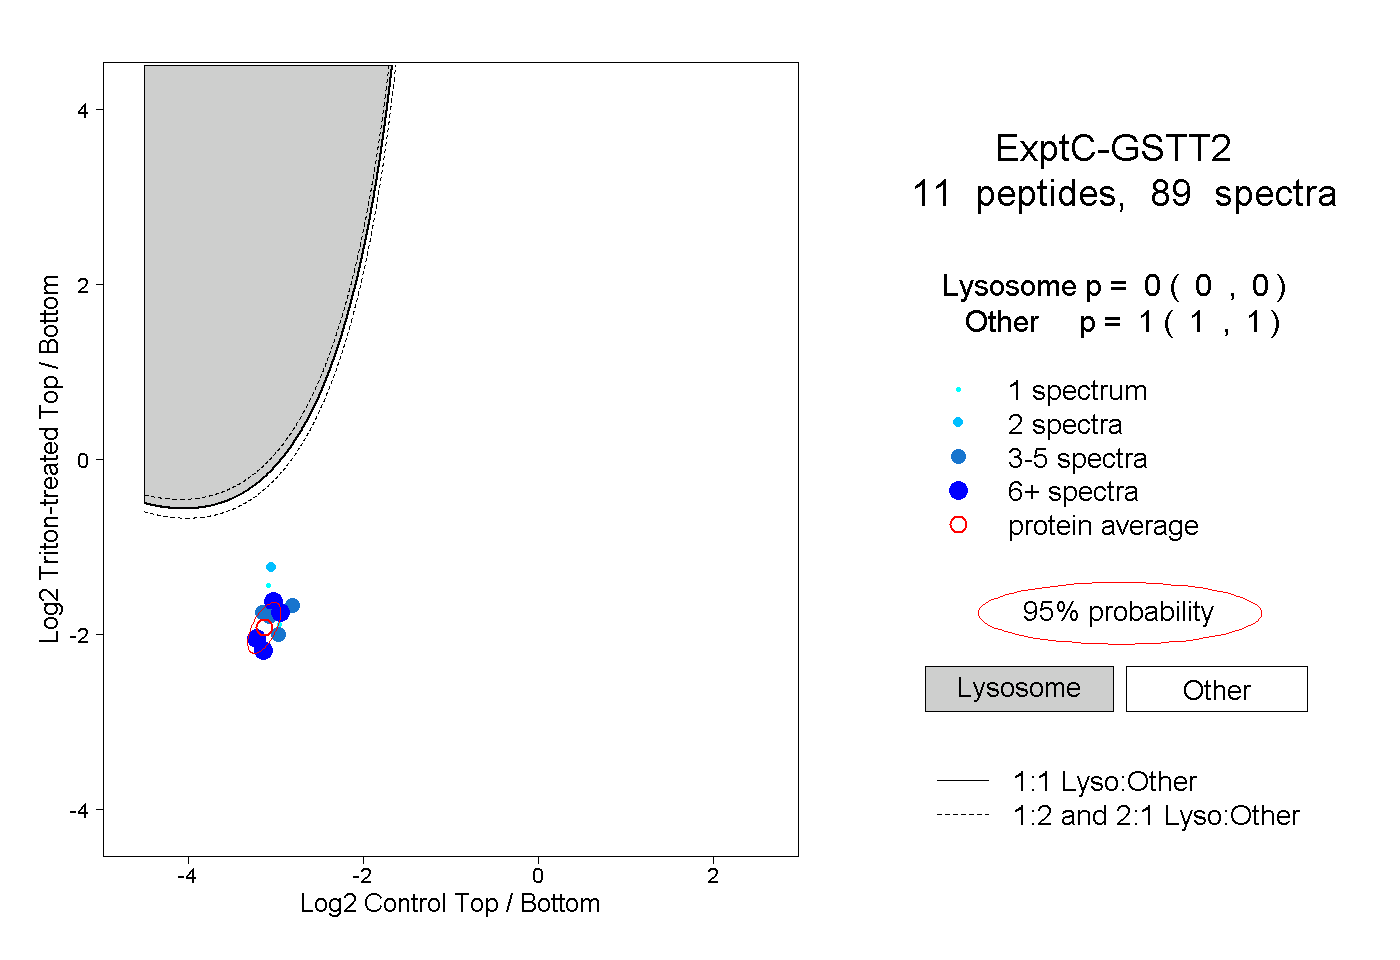 |
0.000 0.000 | 0.000 |
1.000 1.000 | 1.000 |
||||||||
| Plot | Lyso | Other | |||||||||||
| Expt D |
2 peptides |
2 spectra |
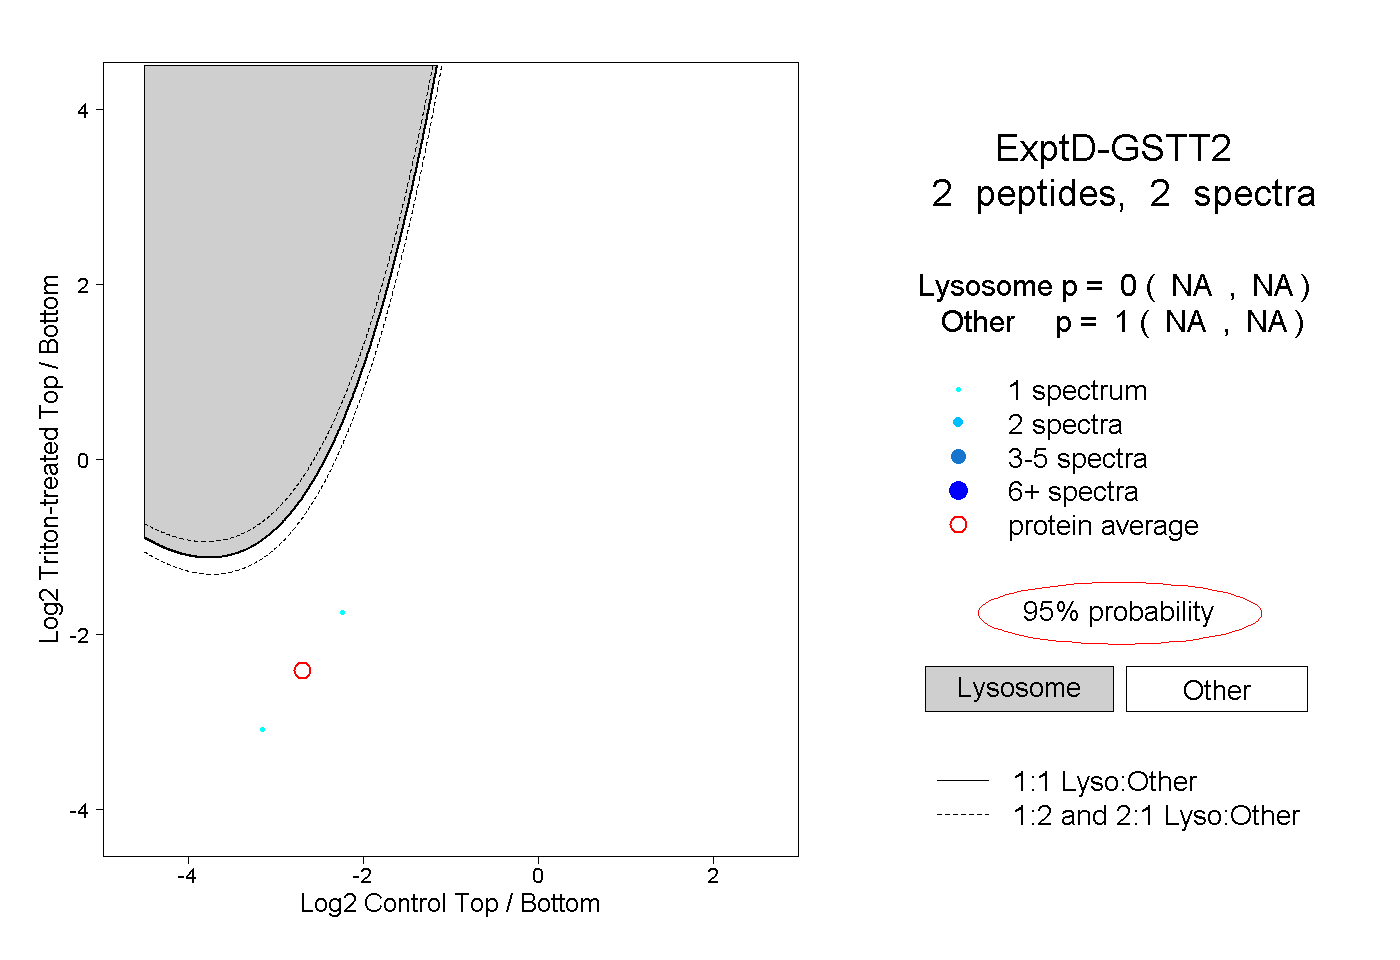 |
0.000 NA | NA |
1.000 NA | NA |