 4
4peptides
spectra
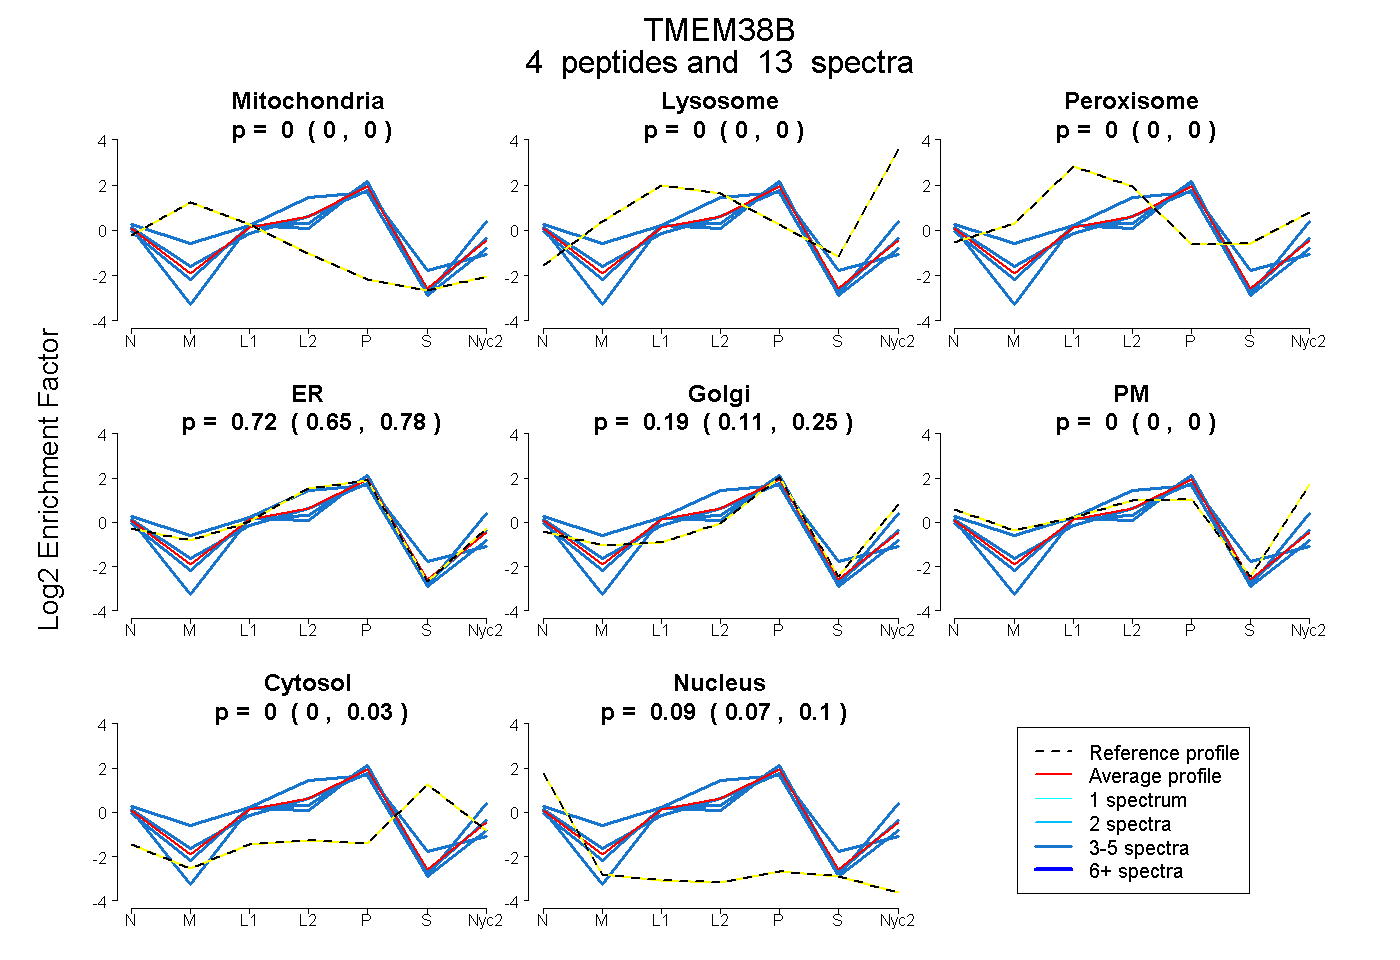
0.000 | 0.000
0.000 | 0.000
0.000 | 0.000
0.655 | 0.783
0.109 | 0.246
0.000 | 0.000
0.000 | 0.035
0.066 | 0.103
2peptides
spectra
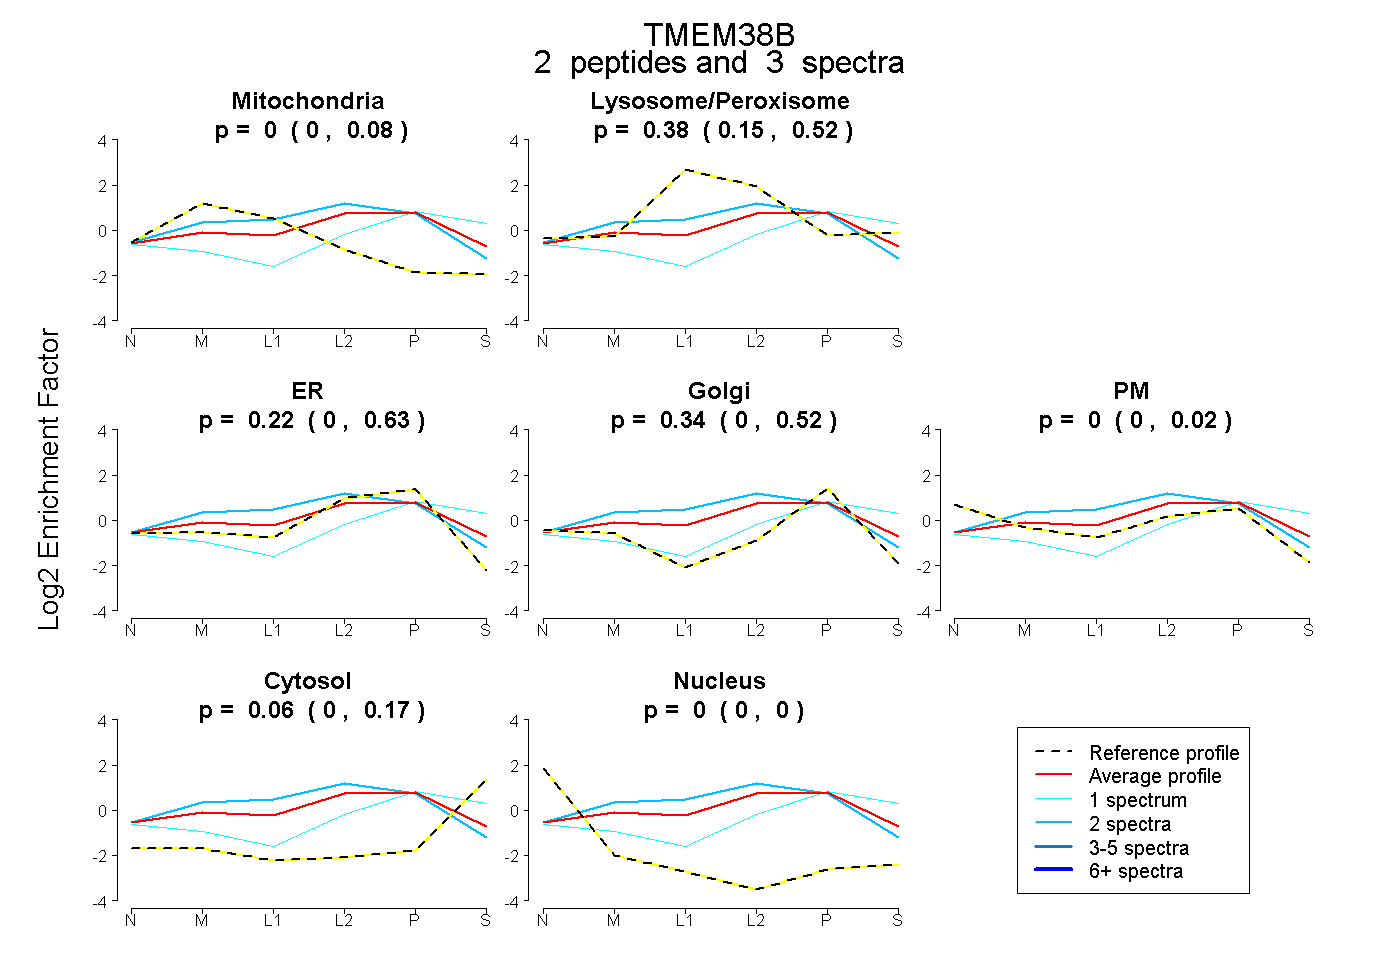
0.000 | 0.077
0.150 | 0.519
0.000 | 0.634
0.000 | 0.518
0.000 | 0.020
0.000 | 0.170
0.000 | 0.000
3peptides
spectra
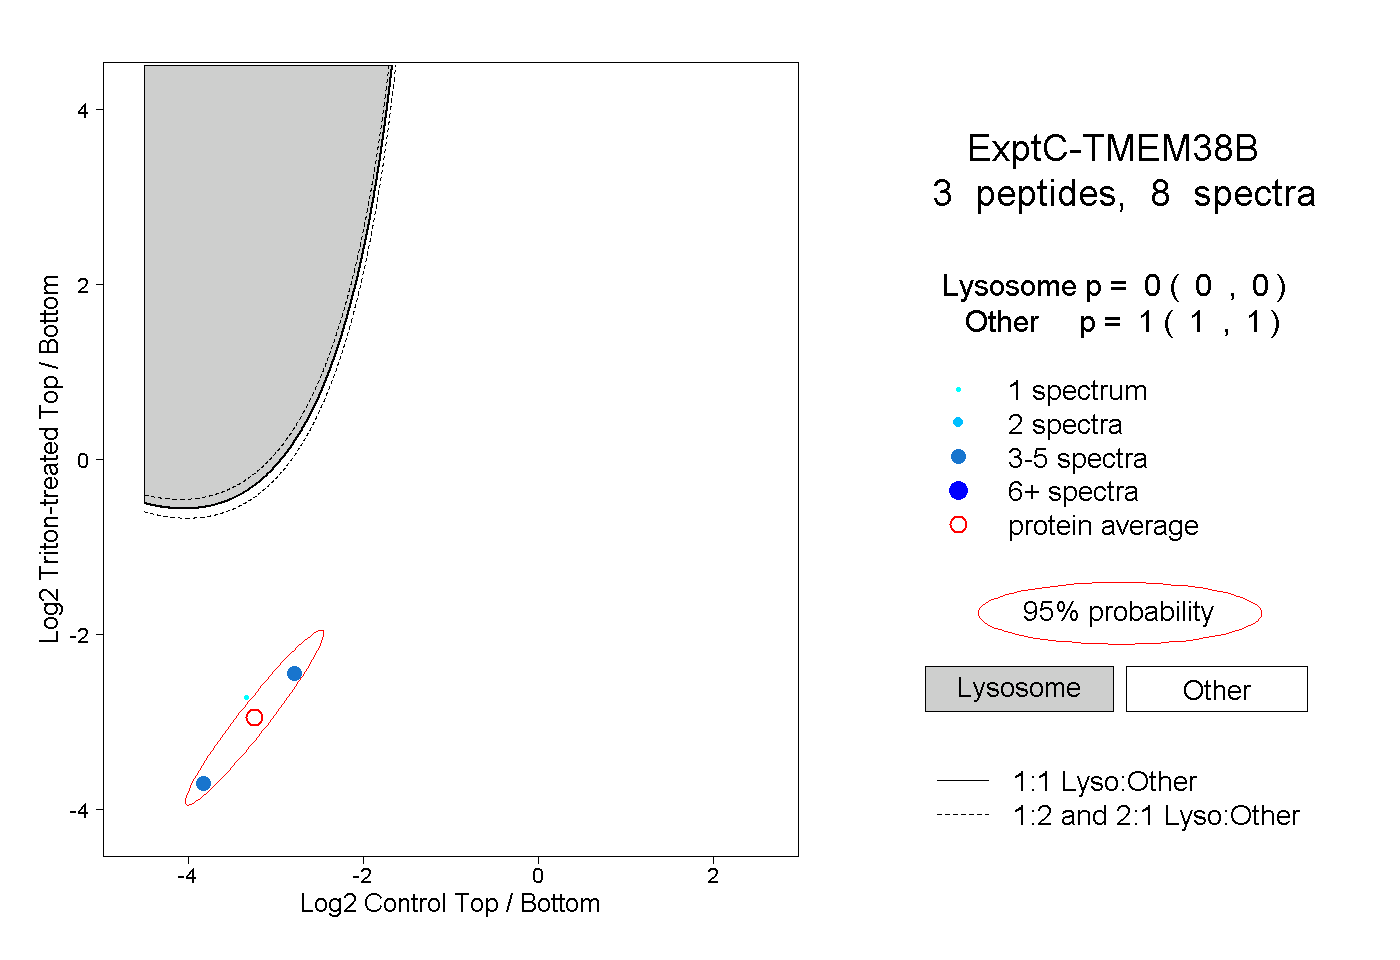
0.000 | 0.000
1.000 | 1.000
1peptide
spectrum
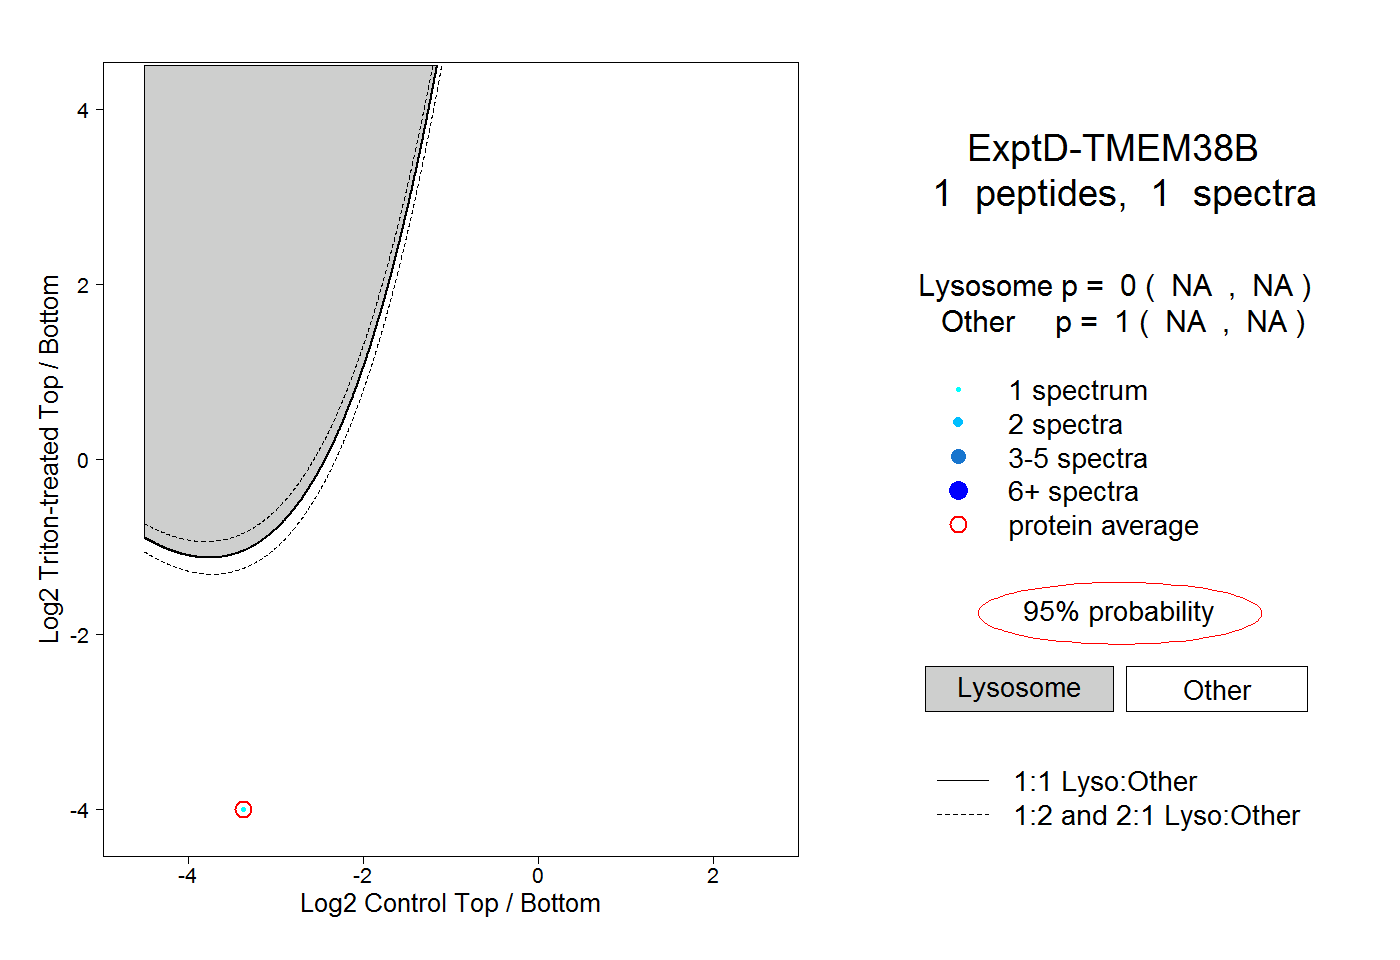
NA | NA
NA | NA