 2
2peptides
spectra
0.000 | 0.110
0.000 | 0.124
0.000 | 0.139
0.000 | 0.175
0.262 | 0.666
0.000 | 0.185
0.176 | 0.445
0.000 | 0.000
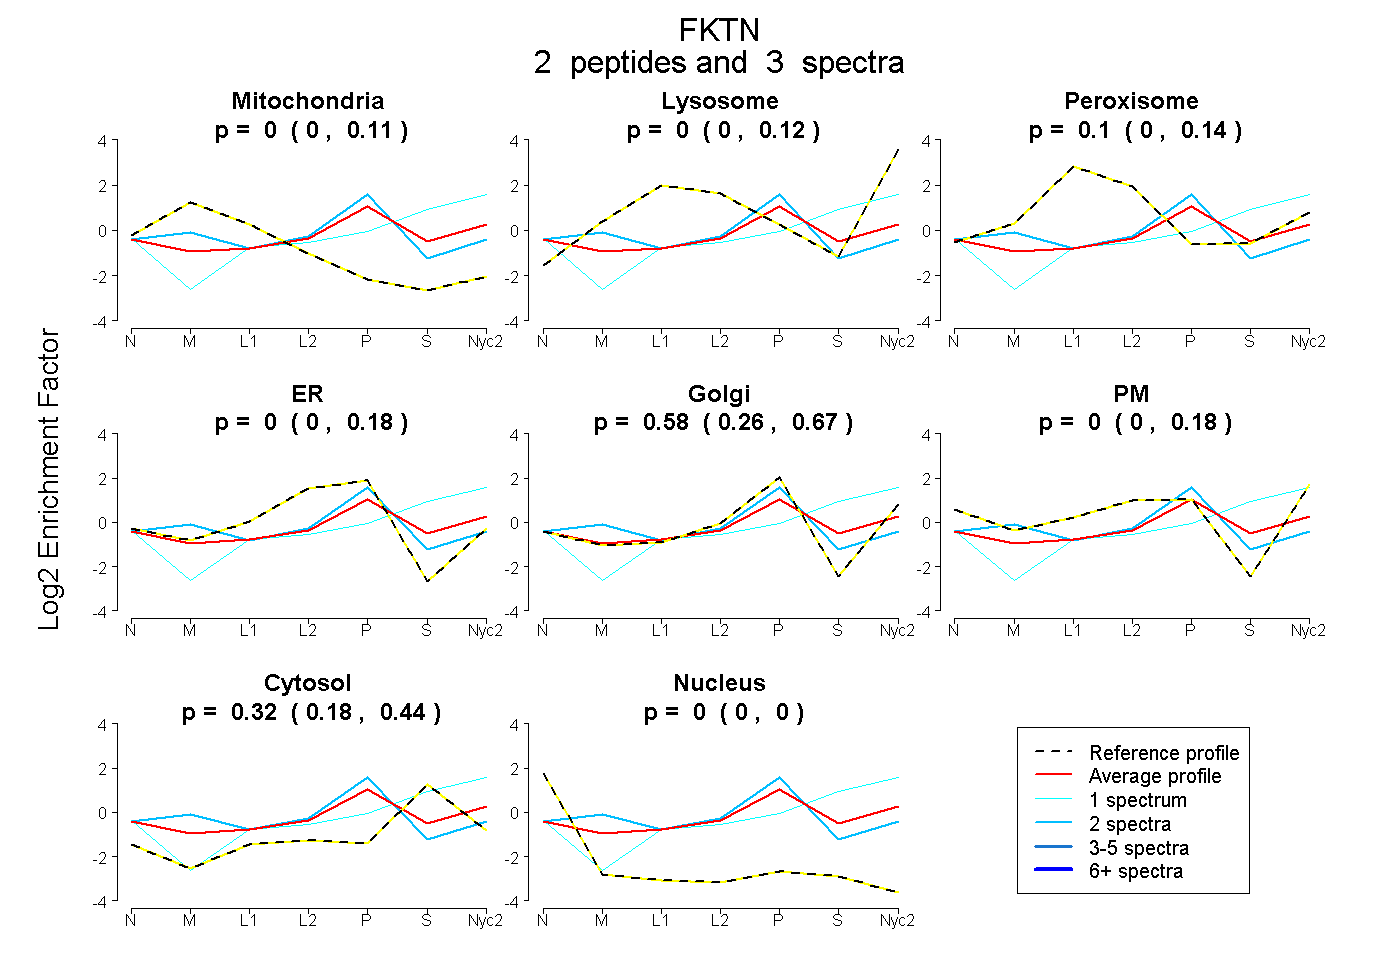
| Plot | Mito | Lyso | Perox | ER | Golgi | PM | Cytosol | Nucleus | |||||
| Expt A |
2 peptides |
3 spectra |
|
0.000 0.000 | 0.110 |
0.000 0.000 | 0.124 |
0.100 0.000 | 0.139 |
0.000 0.000 | 0.175 |
0.580 0.262 | 0.666 |
0.000 0.000 | 0.185 |
0.320 0.176 | 0.445 |
0.000 0.000 | 0.000 |
| 1 spectrum, FVPFR | 0.000 | 0.172 | 0.000 | 0.000 | 0.000 | 0.188 | 0.640 | 0.000 | ||
| 2 spectra, FLEEVPHSR | 0.143 | 0.000 | 0.000 | 0.151 | 0.560 | 0.000 | 0.146 | 0.000 |