 3
3peptides
spectra

0.000 | 0.000
0.014 | 0.454
0.000 | 0.452
0.000 | 0.294
0.000 | 0.000
0.200 | 0.548
0.000 | 0.035
0.000 | 0.000
2peptides
spectra
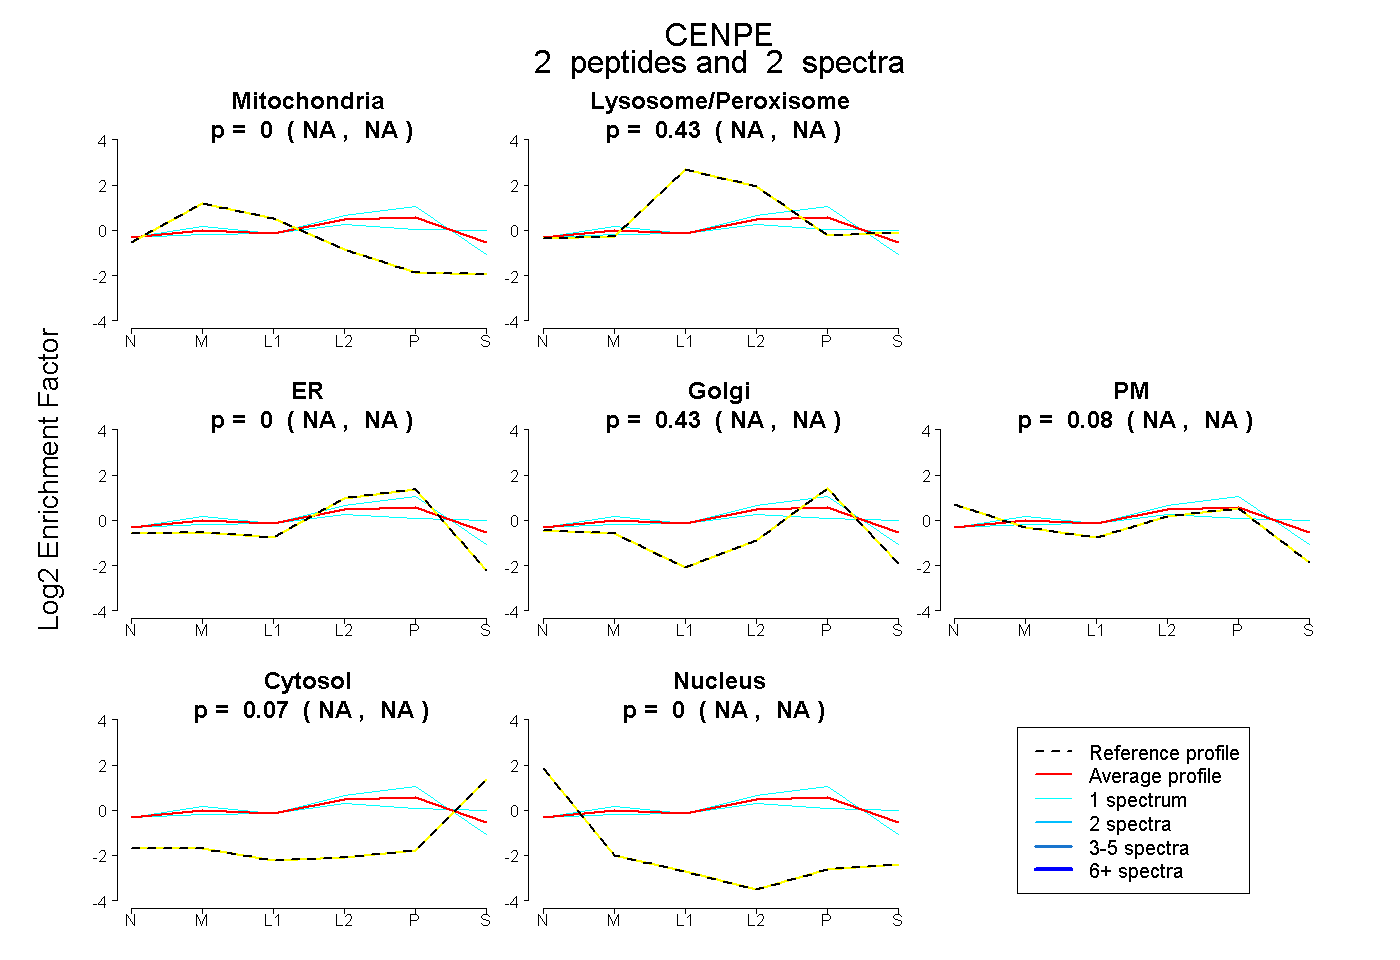
NA | NA
NA | NA
NA | NA
NA | NA
NA | NA
NA | NA
NA | NA
2peptides
spectra
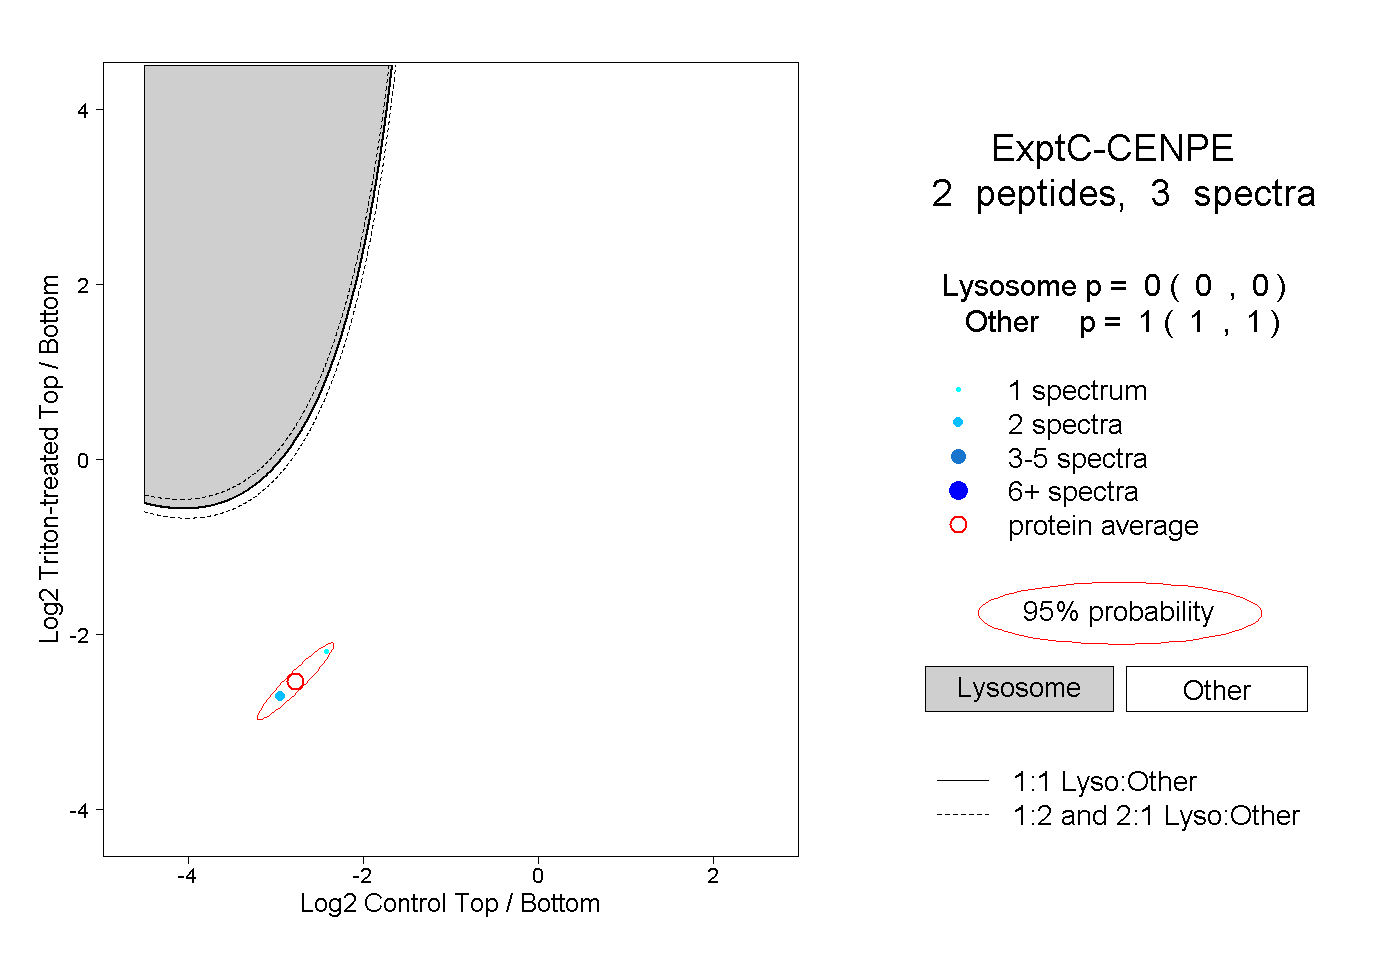
0.000 | 0.000
1.000 | 1.000
2peptides
spectra
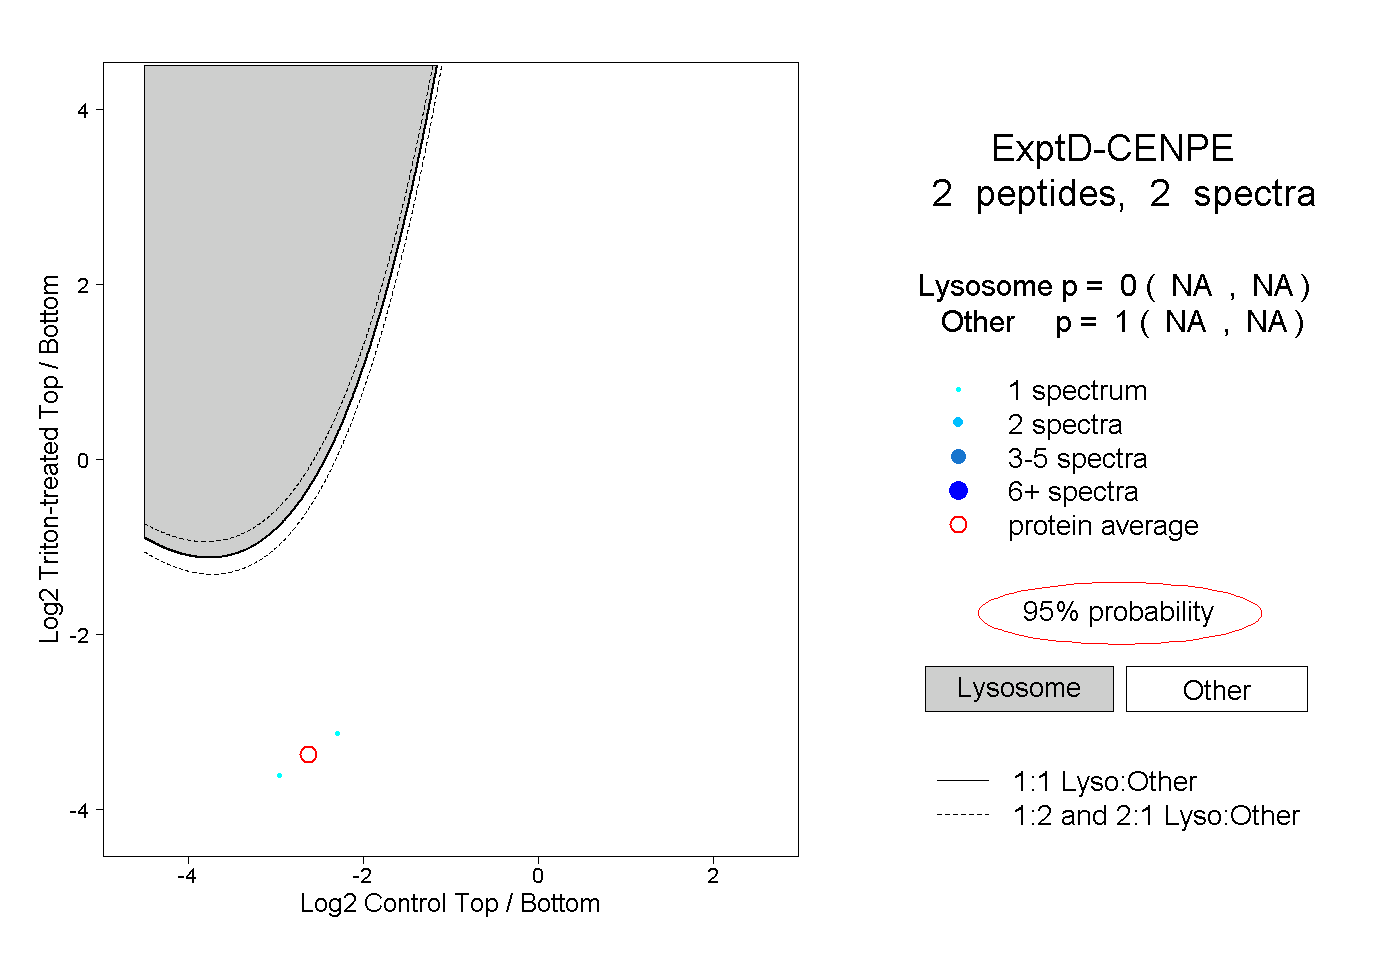
NA | NA
NA | NA