 2
2peptides
spectra
0.000 | 0.000
0.000 | 0.000
0.000 | 0.000
0.407 | 0.652
0.291 | 0.525
0.000 | 0.020
0.000 | 0.000
0.013 | 0.053
1peptide
spectra
NA | NA
NA | NA
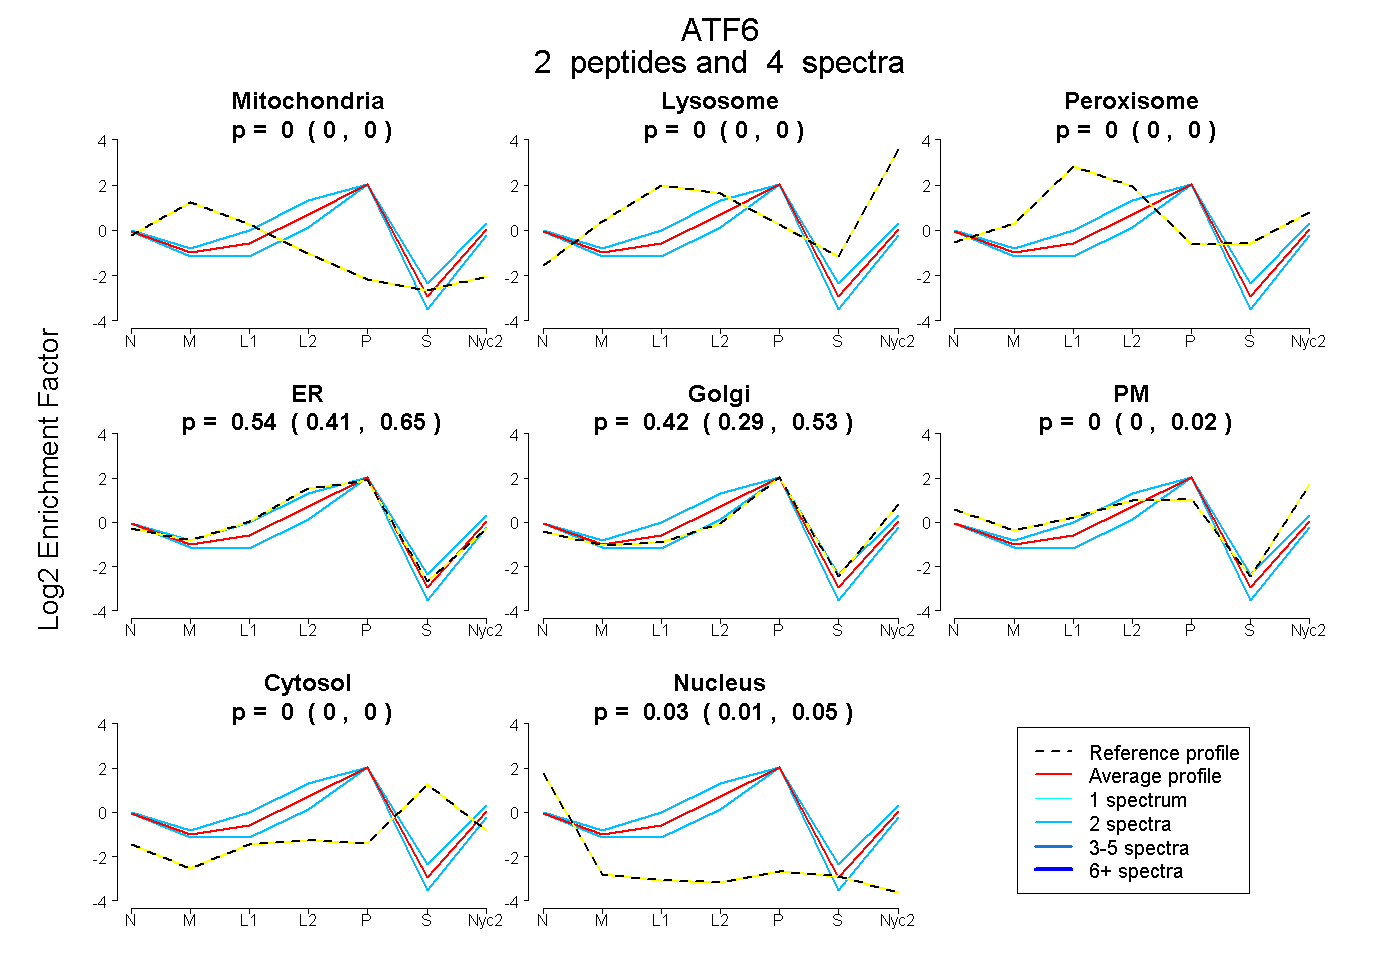
| Plot | Mito | Lyso | Perox | ER | Golgi | PM | Cytosol | Nucleus | |||||
| Expt A |
2 peptides |
4 spectra |
|
0.000 0.000 | 0.000 |
0.000 0.000 | 0.000 |
0.000 0.000 | 0.000 |
0.544 0.407 | 0.652 |
0.421 0.291 | 0.525 |
0.000 0.000 | 0.020 |
0.000 0.000 | 0.000 |
0.035 0.013 | 0.053 |
||
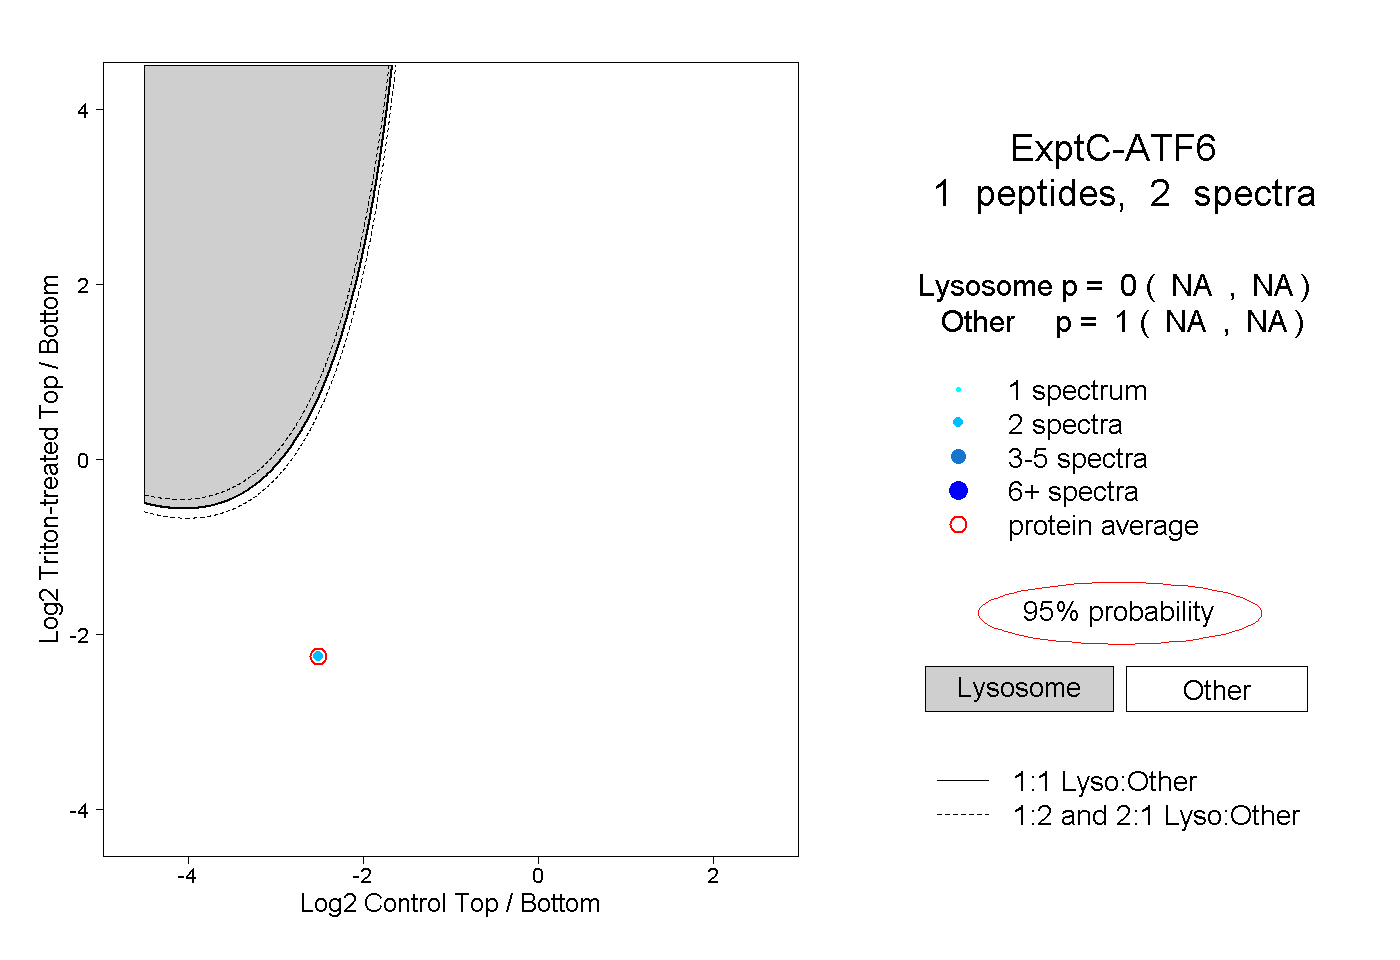
| Plot | Lyso | Other | |||||||||||
| Expt C |
1 peptide |
2 spectra |
|
0.000 NA | NA |
1.000 NA | NA |