 4
4peptides
spectra
0.000 | 0.098
0.000 | 0.000
0.000 | 0.086
0.154 | 0.409
0.000 | 0.048
0.000 | 0.008
0.490 | 0.710
0.000 | 0.081
2peptides
spectra
NA | NA
NA | NA
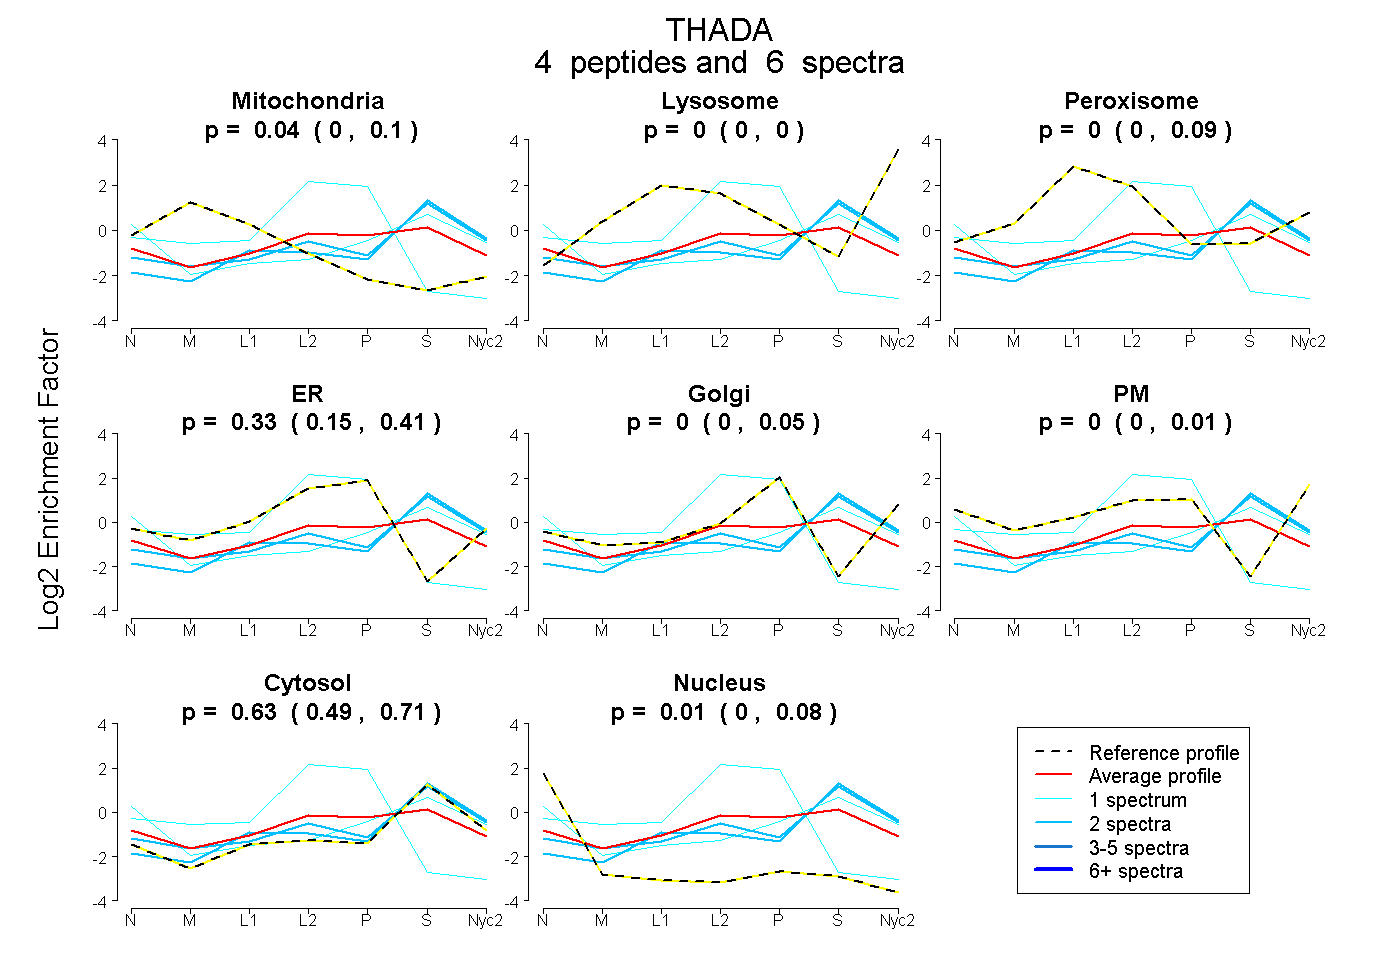
| Plot | Mito | Lyso | Perox | ER | Golgi | PM | Cytosol | Nucleus | |||||
| Expt A |
4 peptides |
6 spectra |
|
0.037 0.000 | 0.098 |
0.000 0.000 | 0.000 |
0.000 0.000 | 0.086 |
0.325 0.154 | 0.409 |
0.000 0.000 | 0.048 |
0.000 0.000 | 0.008 |
0.632 0.490 | 0.710 |
0.006 0.000 | 0.081 |
||
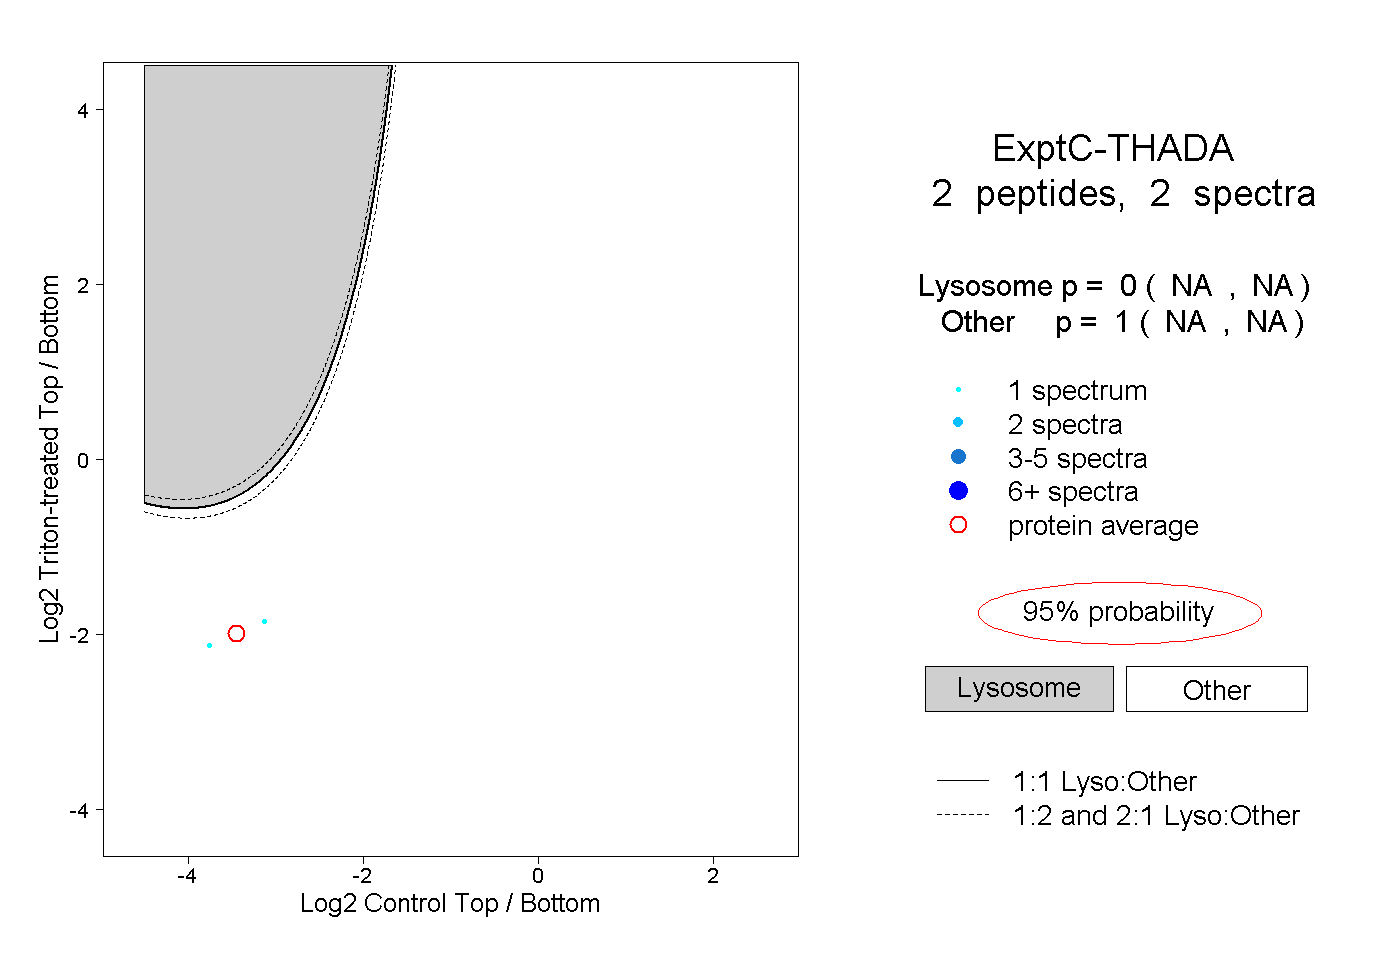
| Plot | Lyso | Other | |||||||||||
| Expt C |
2 peptides |
2 spectra |
|
0.000 NA | NA |
1.000 NA | NA |