 2
2peptides
spectra
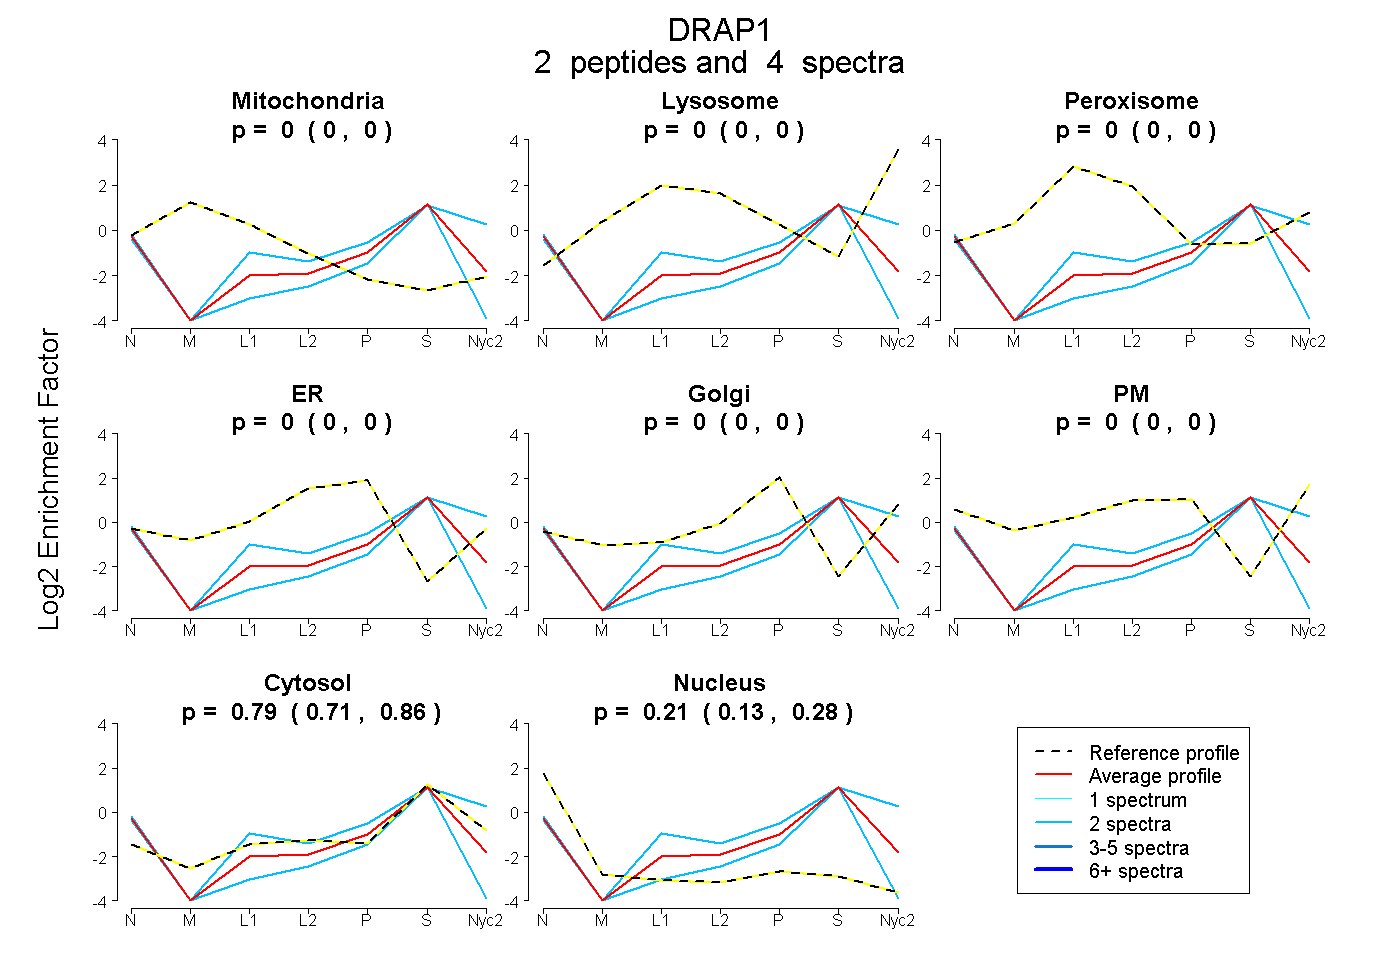
0.000 | 0.000
0.000 | 0.000
0.000 | 0.000
0.000 | 0.000
0.000 | 0.000
0.000 | 0.000
0.709 | 0.863
0.126 | 0.276
| Plot | Mito | Lyso | Perox | ER | Golgi | PM | Cytosol | Nucleus | |||||
| Expt A |
2 peptides |
4 spectra |
|
0.000 0.000 | 0.000 |
0.000 0.000 | 0.000 |
0.000 0.000 | 0.000 |
0.000 0.000 | 0.000 |
0.000 0.000 | 0.000 |
0.000 0.000 | 0.000 |
0.793 0.709 | 0.863 |
0.207 0.126 | 0.276 |
| 2 spectra, VAAAVPVIISR | 0.000 | 0.000 | 0.000 | 0.000 | 0.000 | 0.000 | 0.574 | 0.426 | ||
| 2 spectra, ACQVTQSR | 0.000 | 0.000 | 0.000 | 0.000 | 0.067 | 0.059 | 0.873 | 0.000 |
| Plot | Mito | Lyso or Perox | ER | Golgi | PM | Cytosol | Nucleus | ||||||
| Expt B |
1 peptide |
1 spectrum |
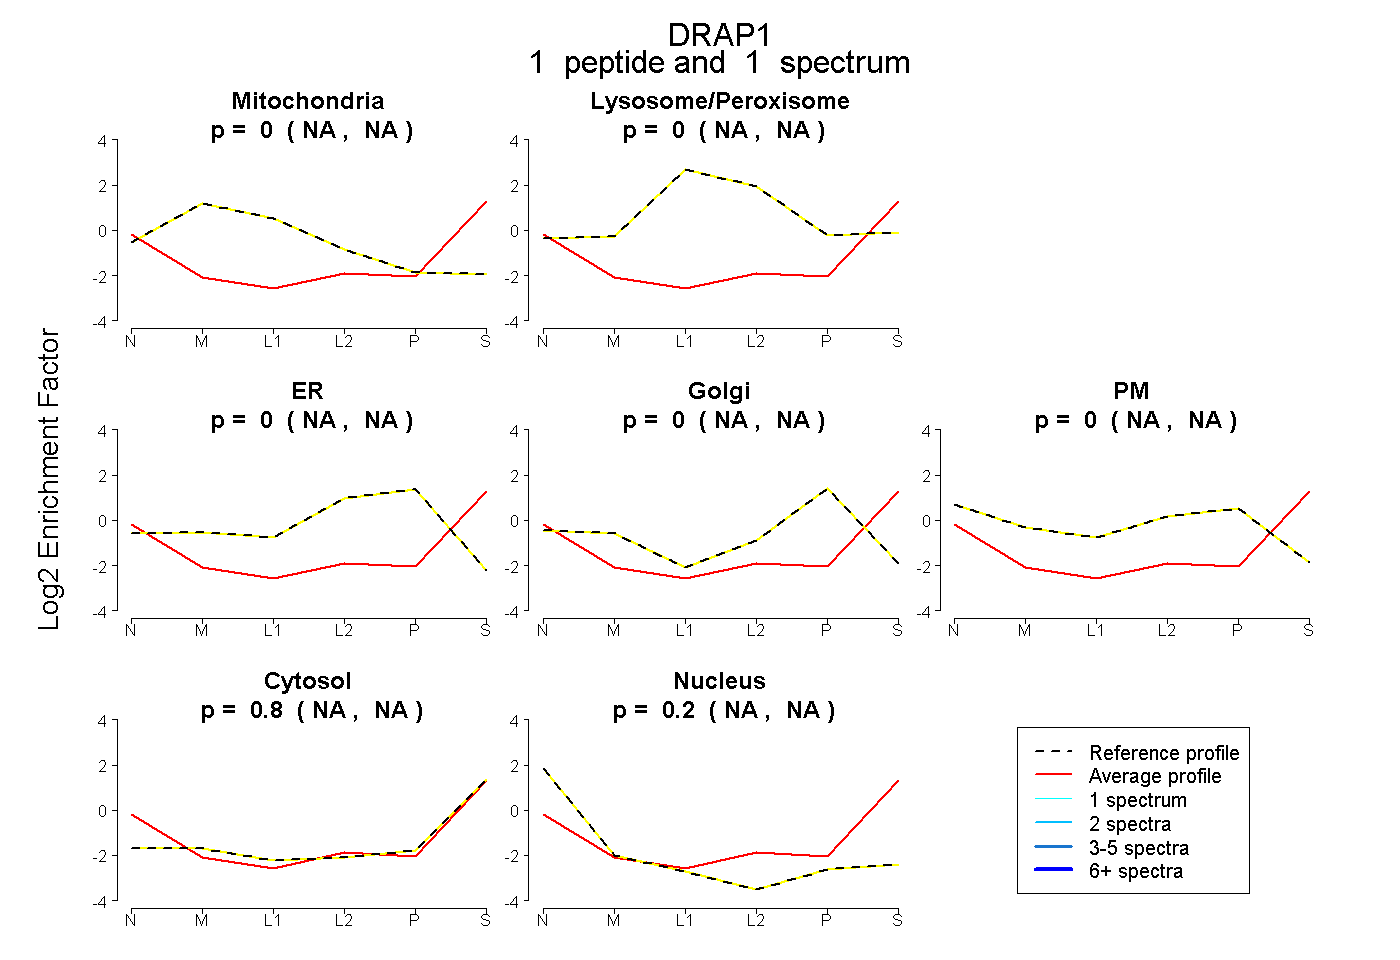 |
0.000 NA | NA |
0.004 NA | NA |
0.000 NA | NA |
0.000 NA | NA |
0.000 NA | NA |
0.798 NA | NA |
0.199 NA | NA |
|||
| Plot | Lyso | Other | |||||||||||
| Expt C |
1 peptide |
1 spectrum |
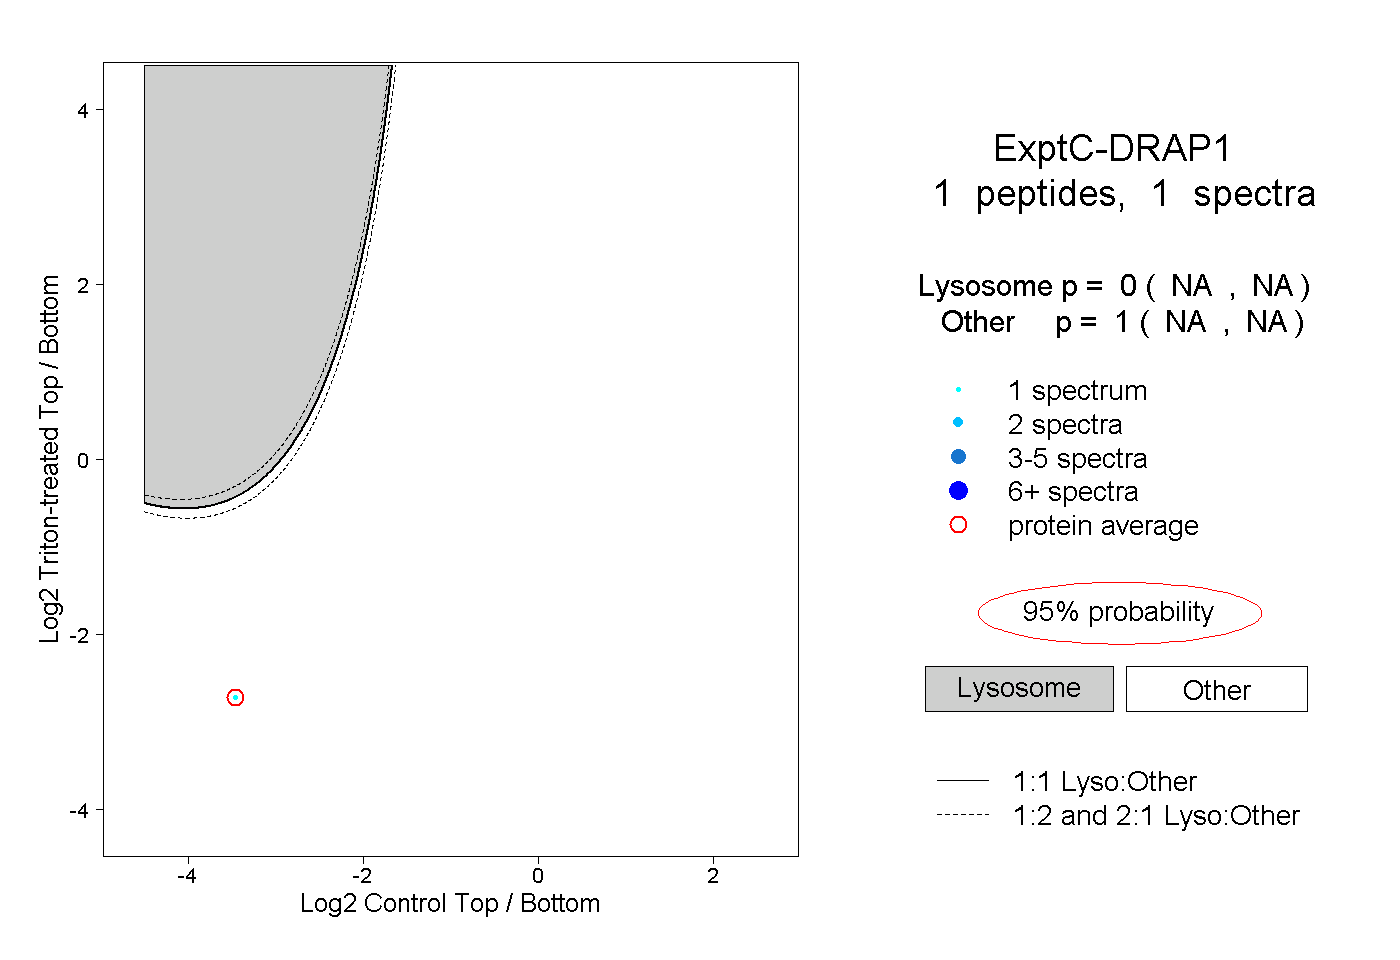 |
0.000 NA | NA |
1.000 NA | NA |