 4
4peptides
spectra
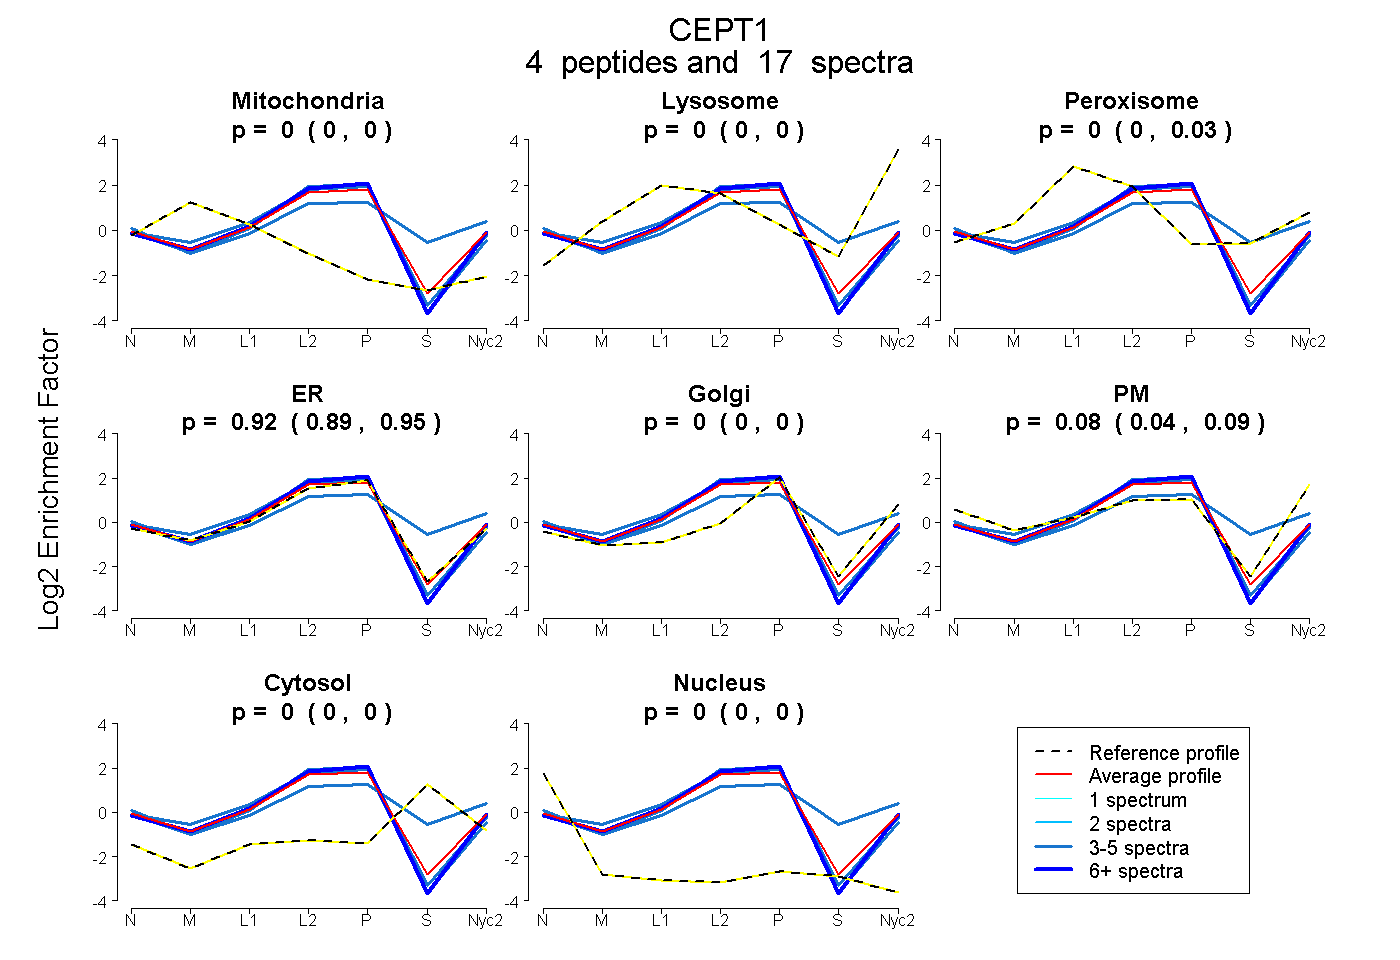
0.000 | 0.000
0.000 | 0.000
0.000 | 0.028
0.894 | 0.946
0.000 | 0.000
0.044 | 0.095
0.000 | 0.000
0.000 | 0.001
3peptides
spectra
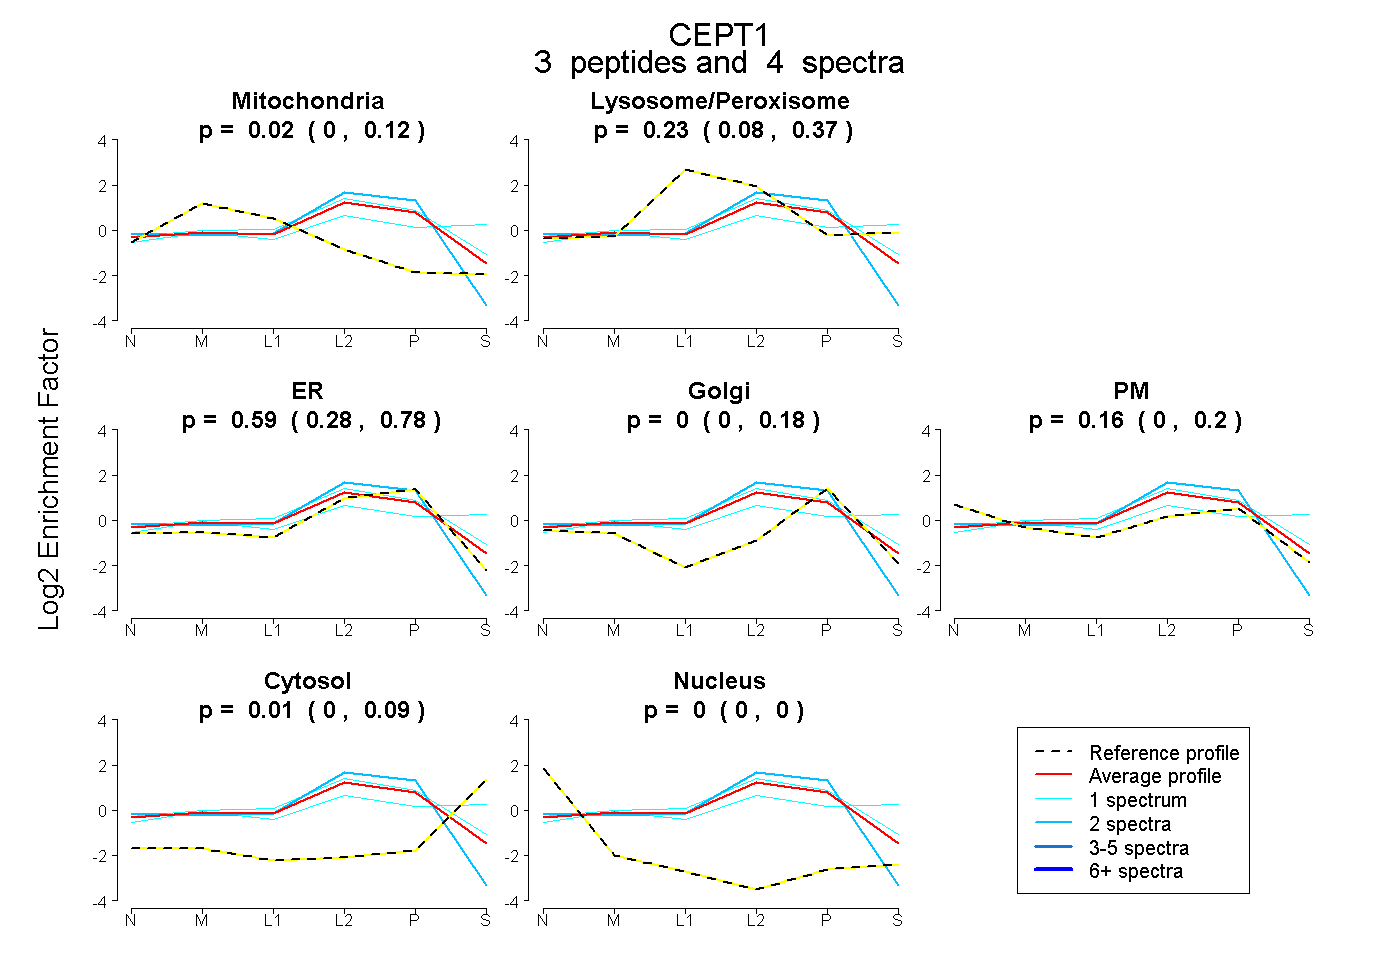
0.000 | 0.124
0.081 | 0.369
0.280 | 0.783
0.000 | 0.185
0.000 | 0.203
0.000 | 0.090
0.000 | 0.000
3peptides
spectra
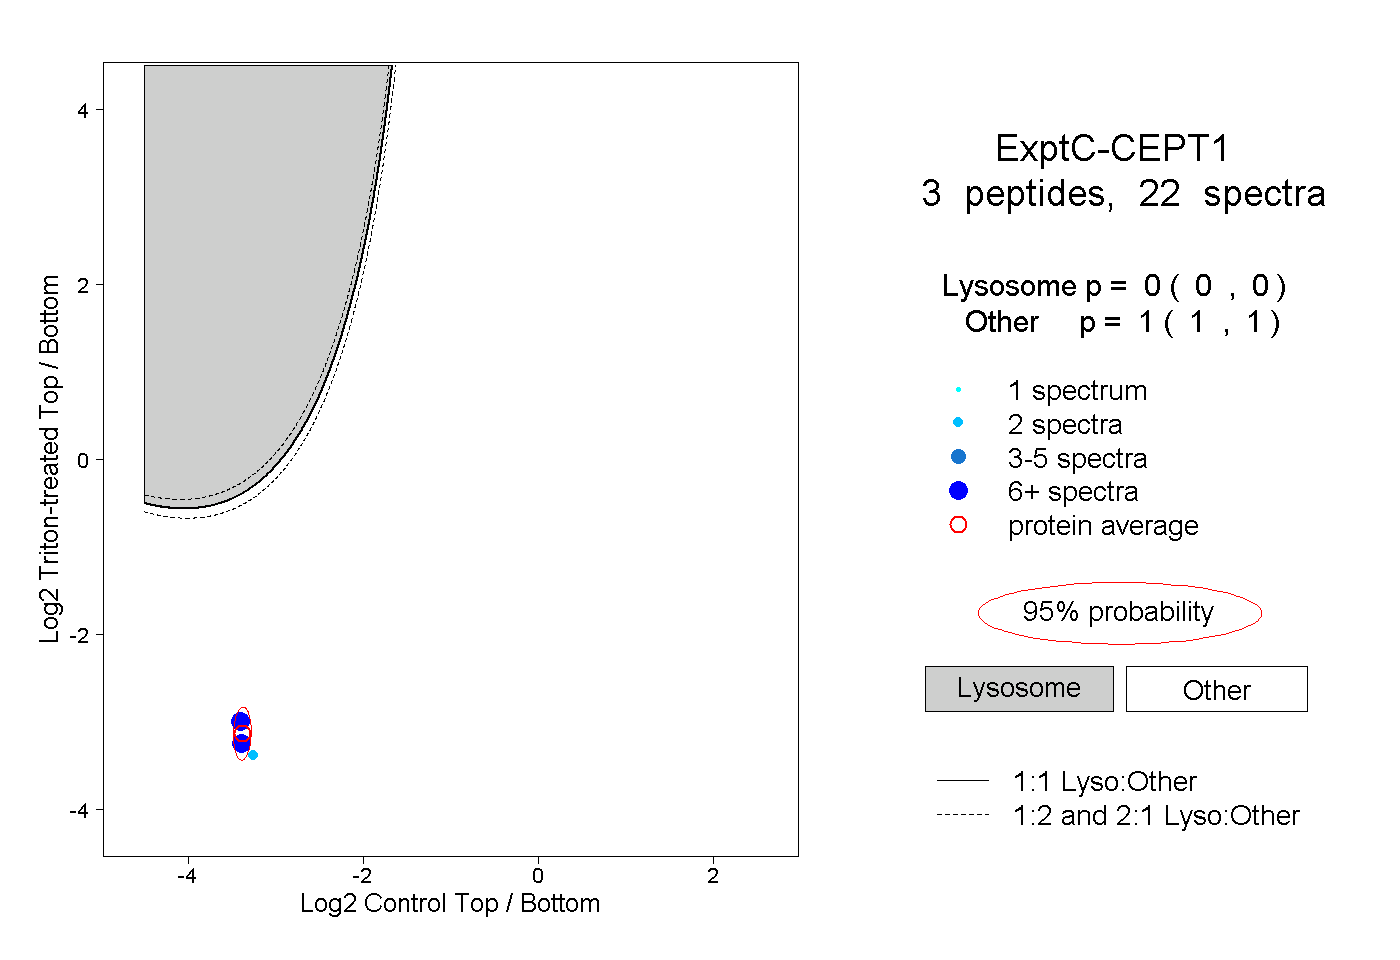
0.000 | 0.000
1.000 | 1.000
1peptide
spectra
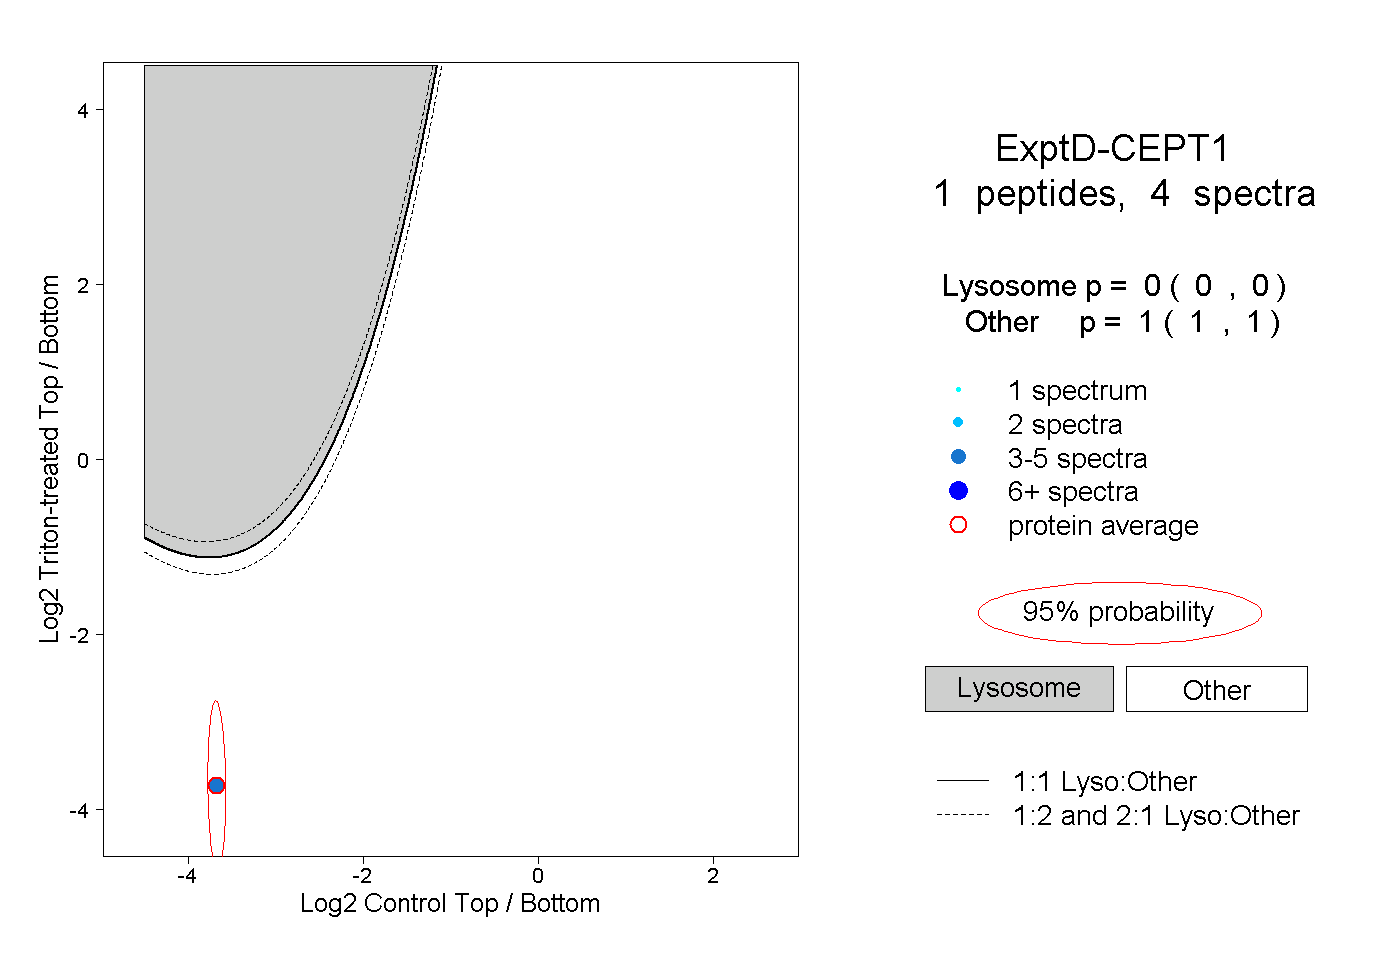
0.000 | 0.000
1.000 | 1.000