 3
3peptides
spectra
0.000 | 0.037
0.000 | 0.000
0.000 | 0.000
0.339 | 0.478
0.000 | 0.091
0.000 | 0.000
0.092 | 0.266
0.294 | 0.433
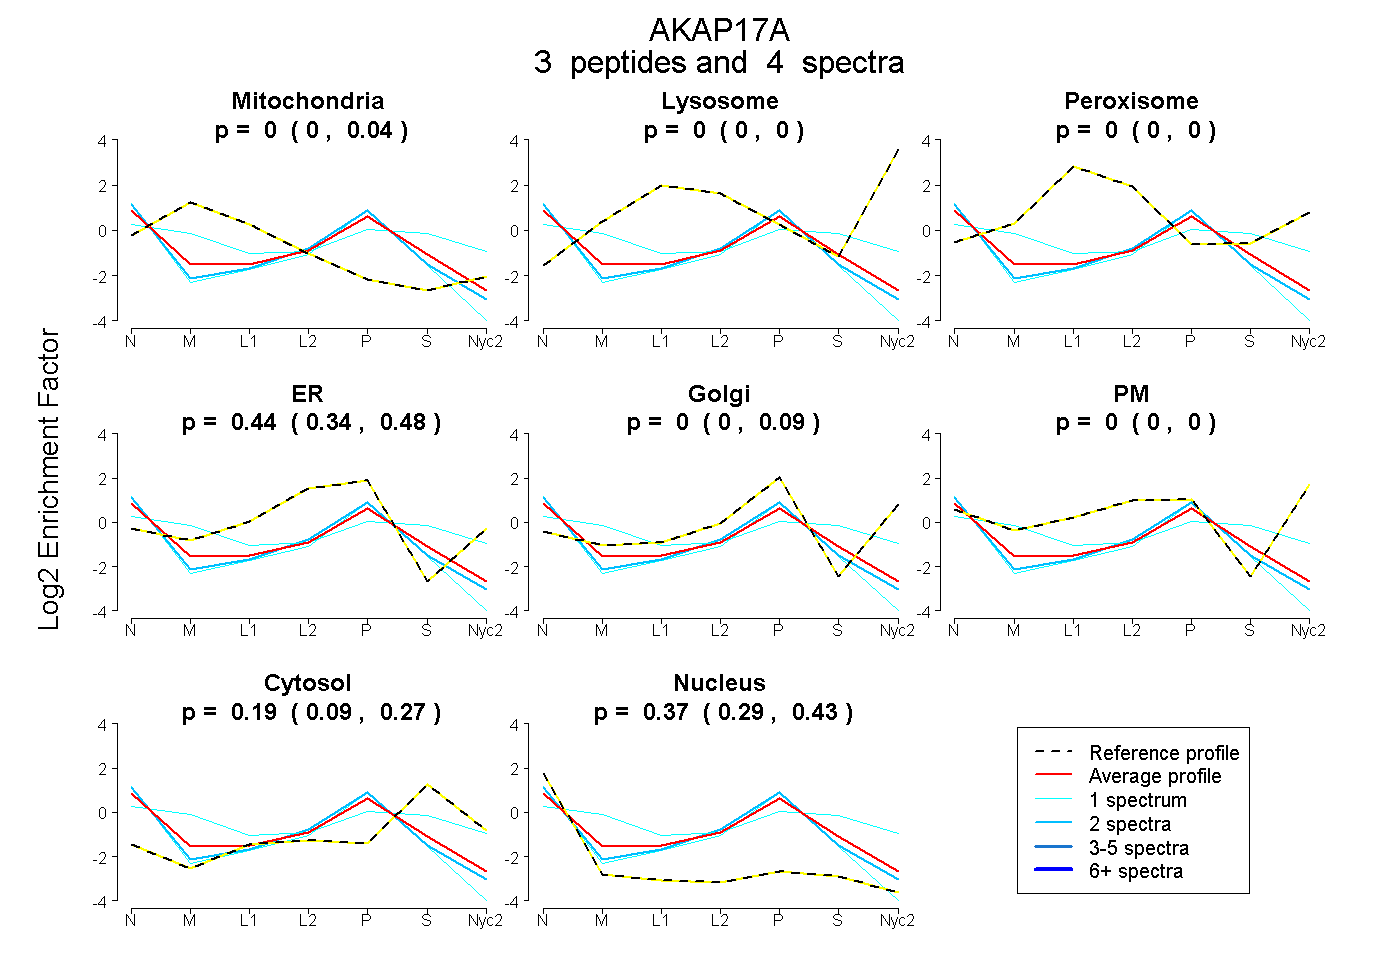
| Plot | Mito | Lyso | Perox | ER | Golgi | PM | Cytosol | Nucleus | |||||
| Expt A |
3 peptides |
4 spectra |
|
0.000 0.000 | 0.037 |
0.000 0.000 | 0.000 |
0.000 0.000 | 0.000 |
0.437 0.339 | 0.478 |
0.000 0.000 | 0.091 |
0.000 0.000 | 0.000 |
0.190 0.092 | 0.266 |
0.373 0.294 | 0.433 |
| 1 spectrum, ALVRPALAGLDGK | 0.000 | 0.000 | 0.000 | 0.417 | 0.000 | 0.000 | 0.037 | 0.546 | ||
| 1 spectrum, AVACGIK | 0.280 | 0.000 | 0.000 | 0.000 | 0.259 | 0.065 | 0.389 | 0.007 | ||
| 2 spectra, AMAQGAR | 0.000 | 0.000 | 0.000 | 0.467 | 0.000 | 0.000 | 0.079 | 0.454 |
| Plot | Lyso | Other | |||||||||||
| Expt C |
1 peptide |
1 spectrum |
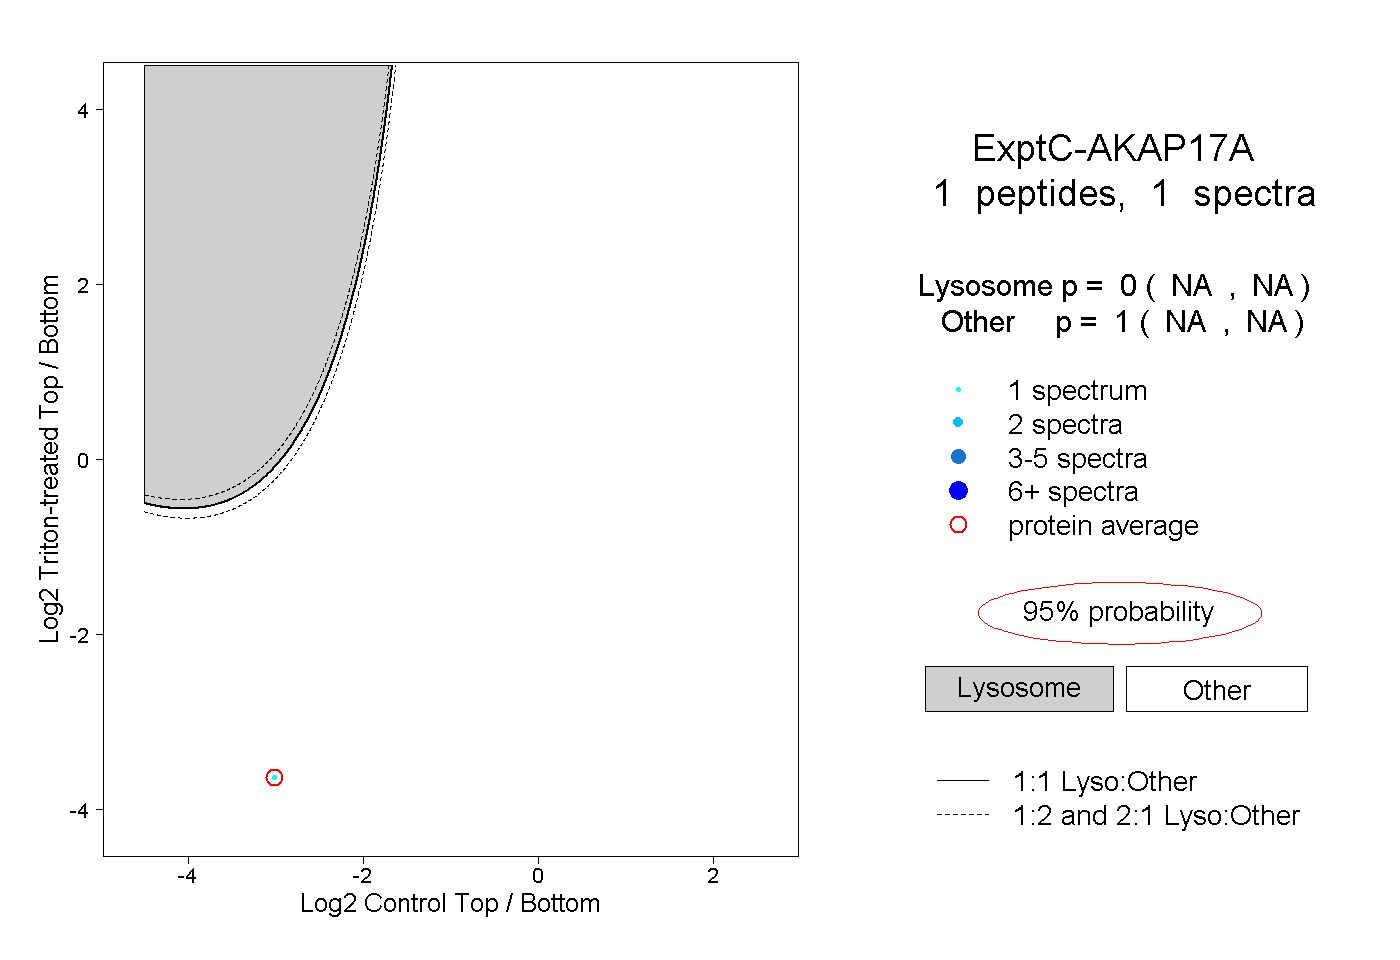 |
0.000 NA | NA |
1.000 NA | NA |