 6
6peptides
spectra
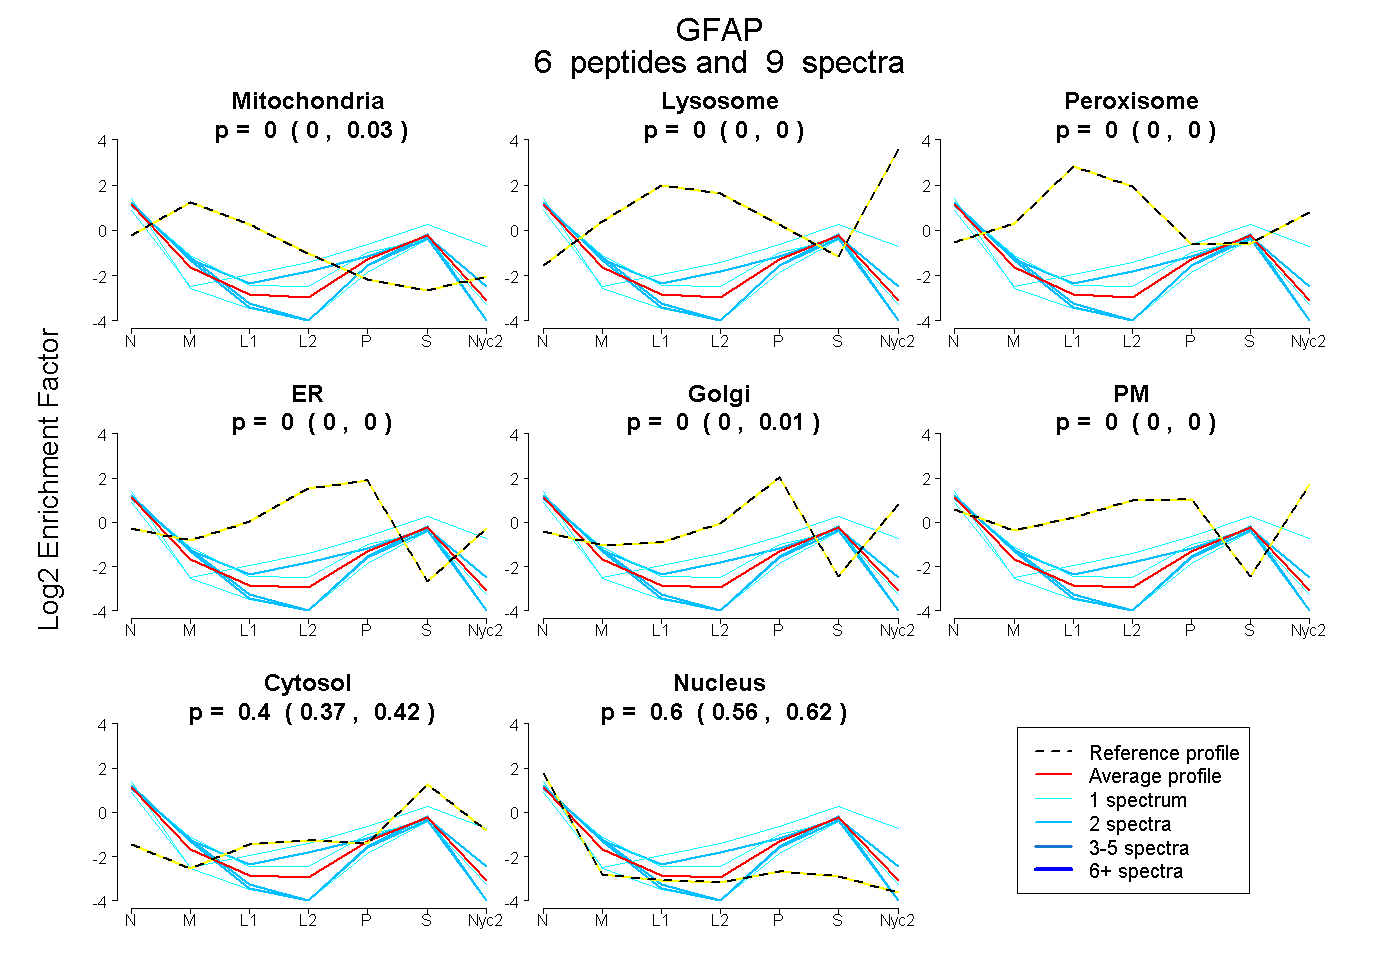
0.000 | 0.030
0.000 | 0.000
0.000 | 0.000
0.000 | 0.000
0.000 | 0.011
0.000 | 0.000
0.370 | 0.418
0.558 | 0.619
1peptide
spectra
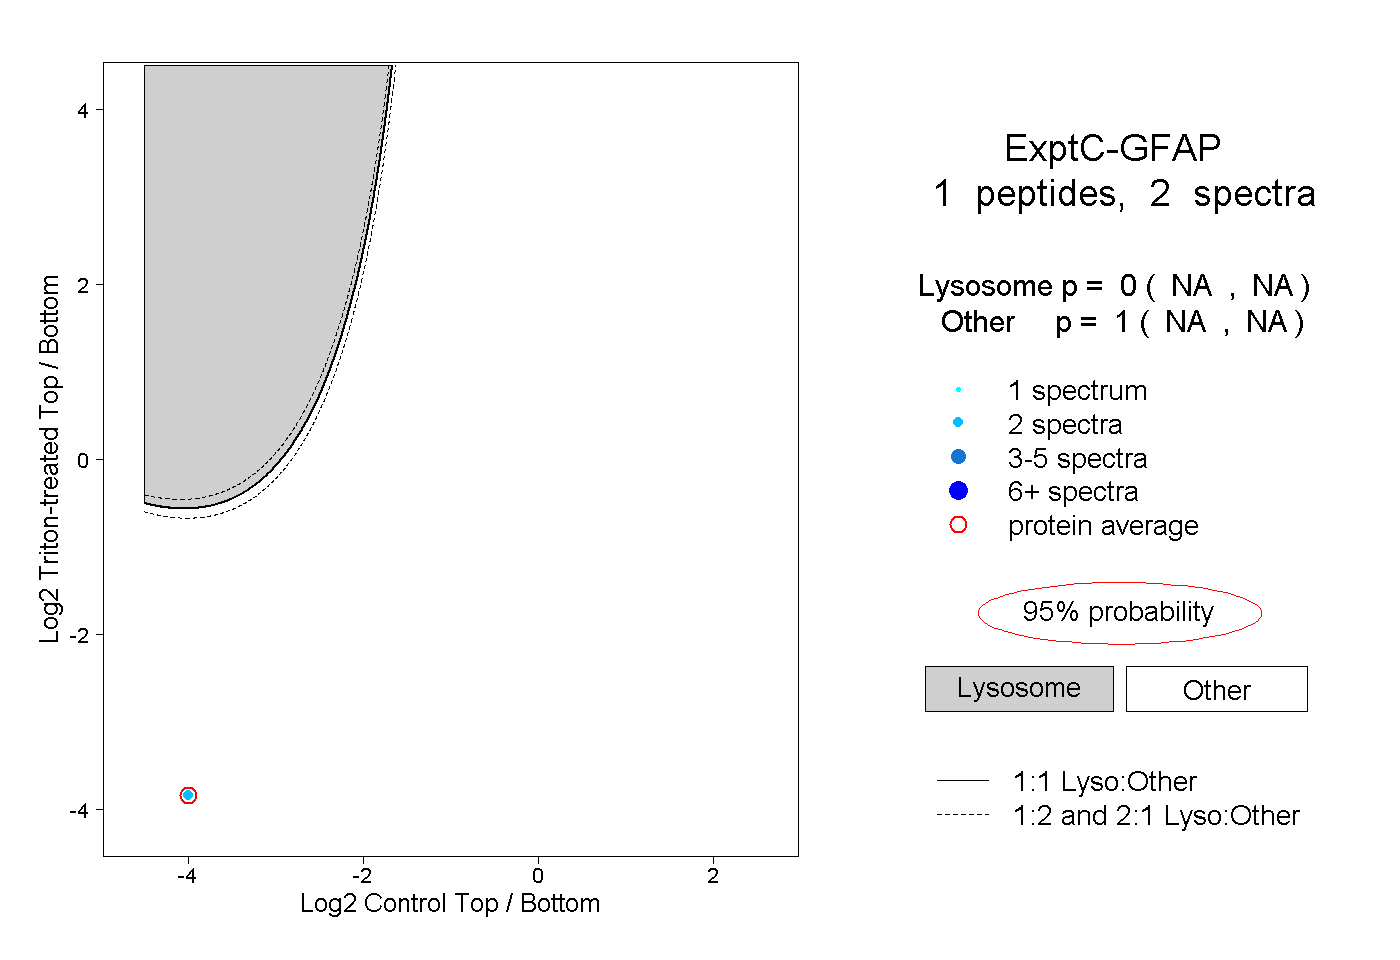
NA | NA
NA | NA
1peptide
spectrum
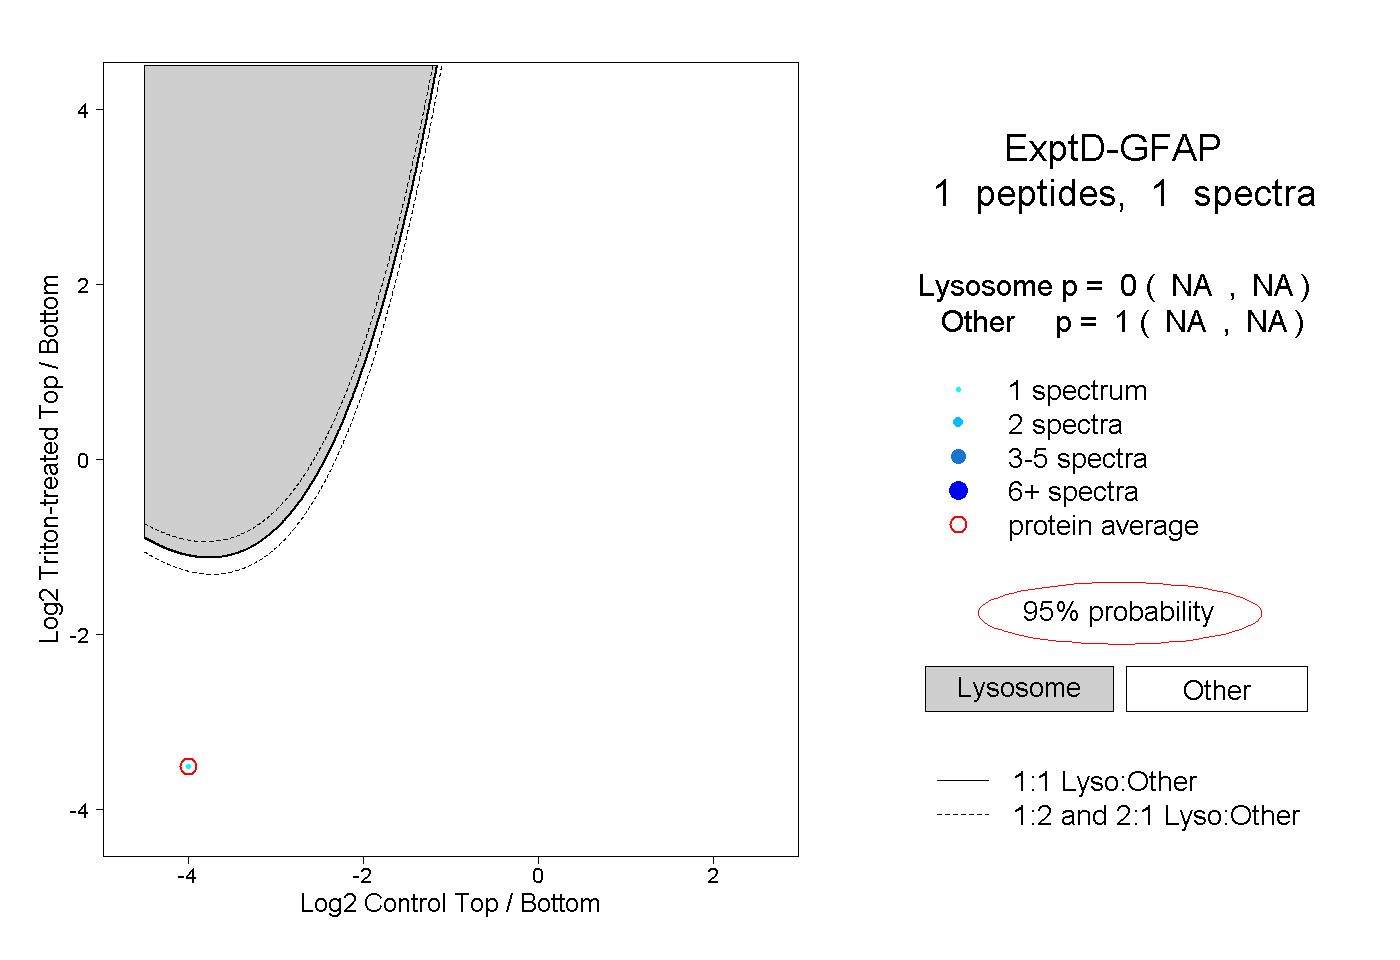
NA | NA
NA | NA