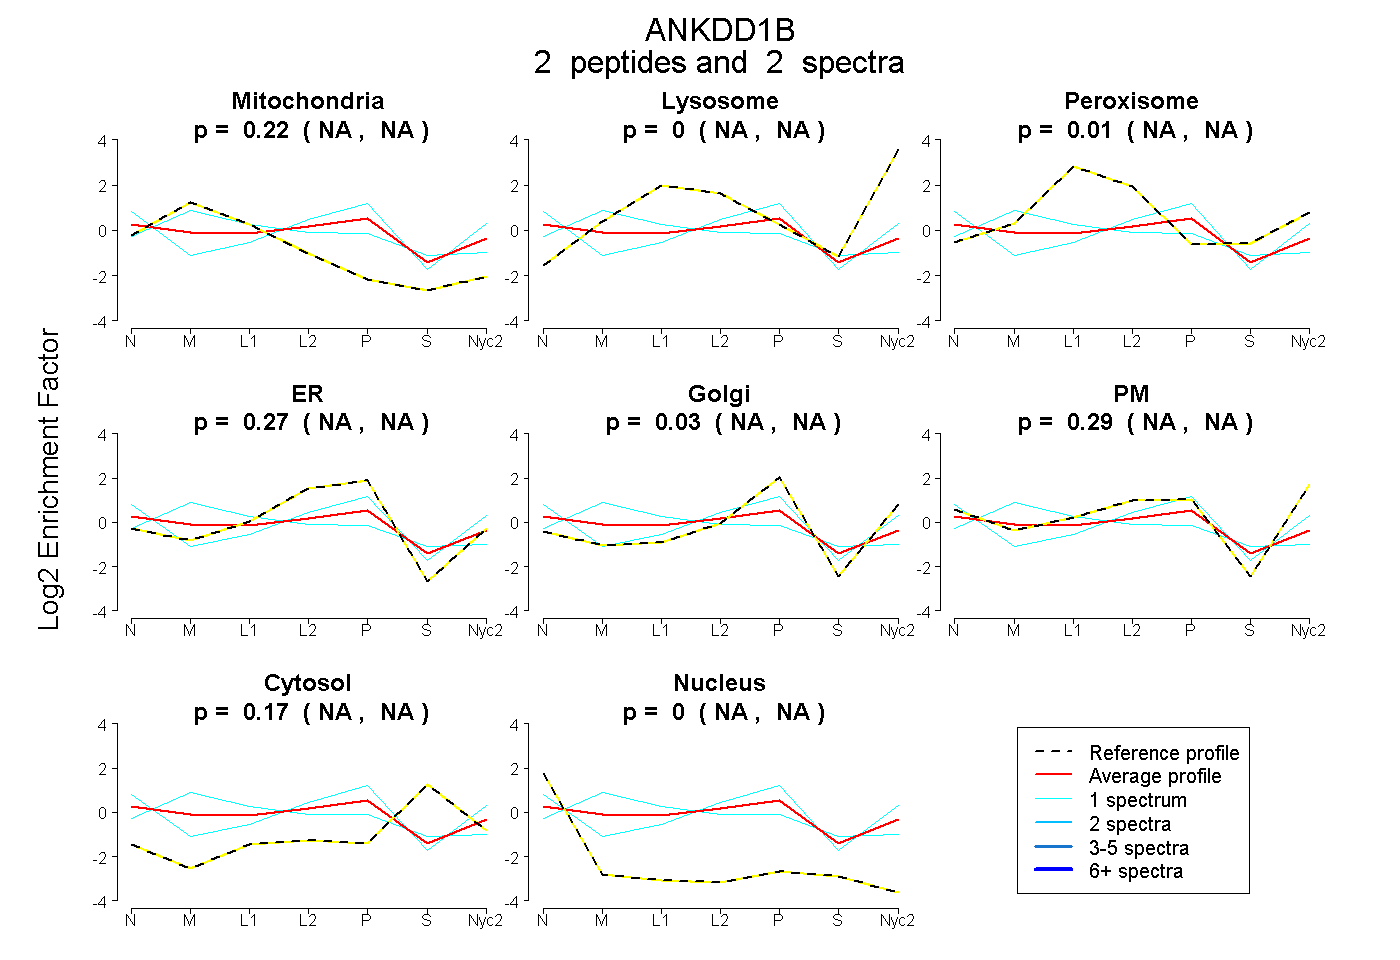
 2
2peptides
spectra
NA | NA
NA | NA
NA | NA
NA | NA
NA | NA
NA | NA
NA | NA
NA | NA
| Plot | Mito | Lyso | Perox | ER | Golgi | PM | Cytosol | Nucleus | |||||
| Expt A |
2 peptides |
2 spectra |
|
0.220 NA | NA |
0.000 NA | NA |
0.015 NA | NA |
0.271 NA | NA |
0.031 NA | NA |
0.295 NA | NA |
0.168 NA | NA |
0.000 NA | NA |
| 1 spectrum, GHVEMIEK | 0.000 | 0.000 | 0.000 | 0.230 | 0.119 | 0.462 | 0.097 | 0.092 | ||
| 1 spectrum, TALAVAAR | 0.431 | 0.000 | 0.212 | 0.101 | 0.160 | 0.000 | 0.097 | 0.000 |
| Plot | Mito | Lyso or Perox | ER | Golgi | PM | Cytosol | Nucleus | ||||||
| Expt B |
1 peptide |
1 spectrum |
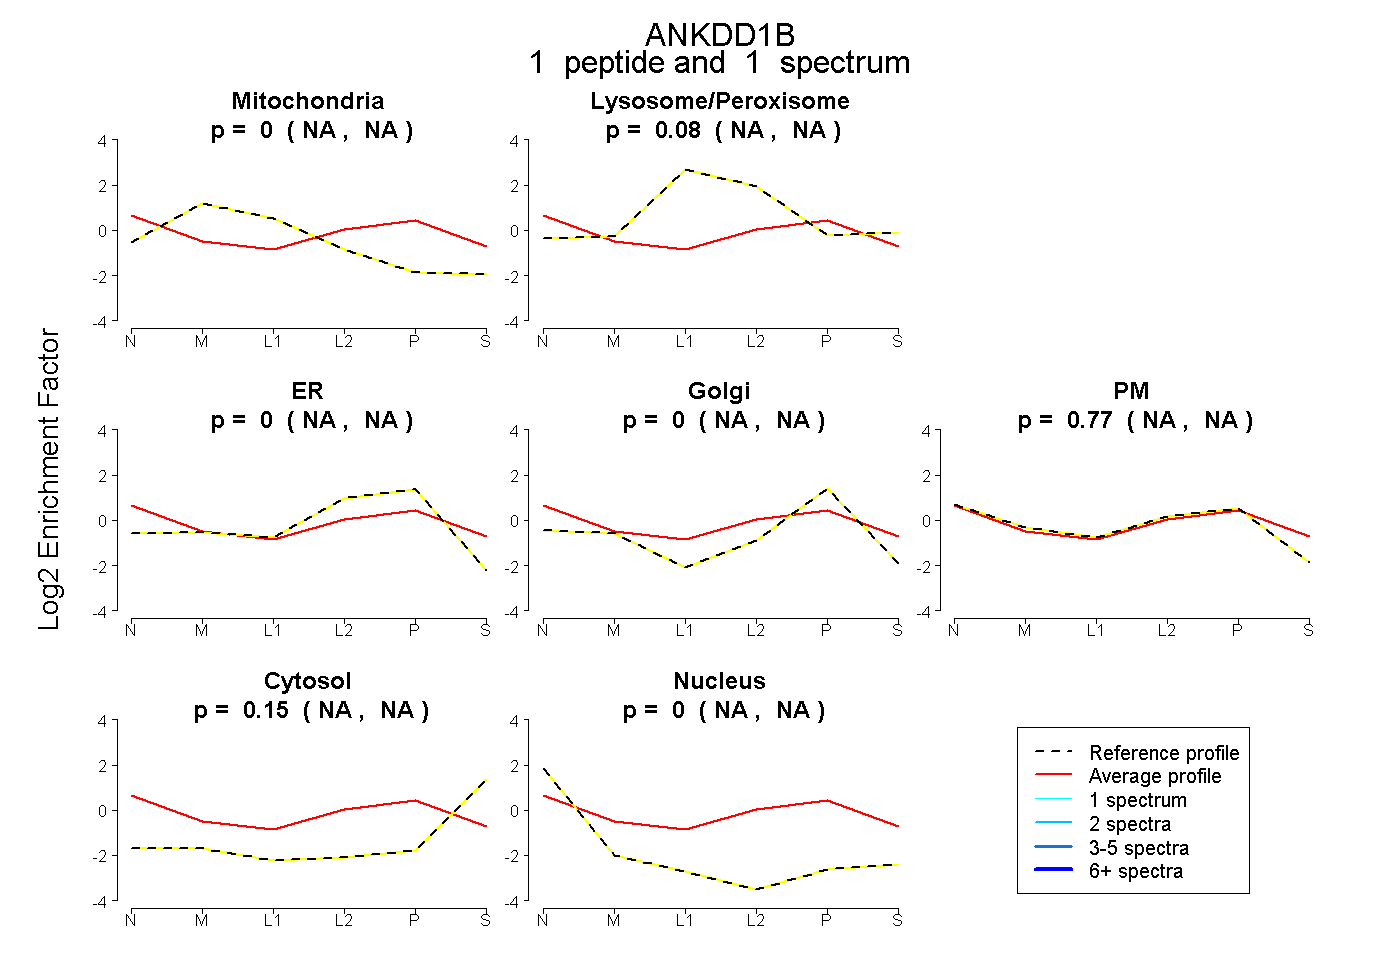 |
0.000 NA | NA |
0.077 NA | NA |
0.000 NA | NA |
0.000 NA | NA |
0.773 NA | NA |
0.150 NA | NA |
0.000 NA | NA |
|||
| Plot | Lyso | Other | |||||||||||
| Expt C |
2 peptides |
7 spectra |
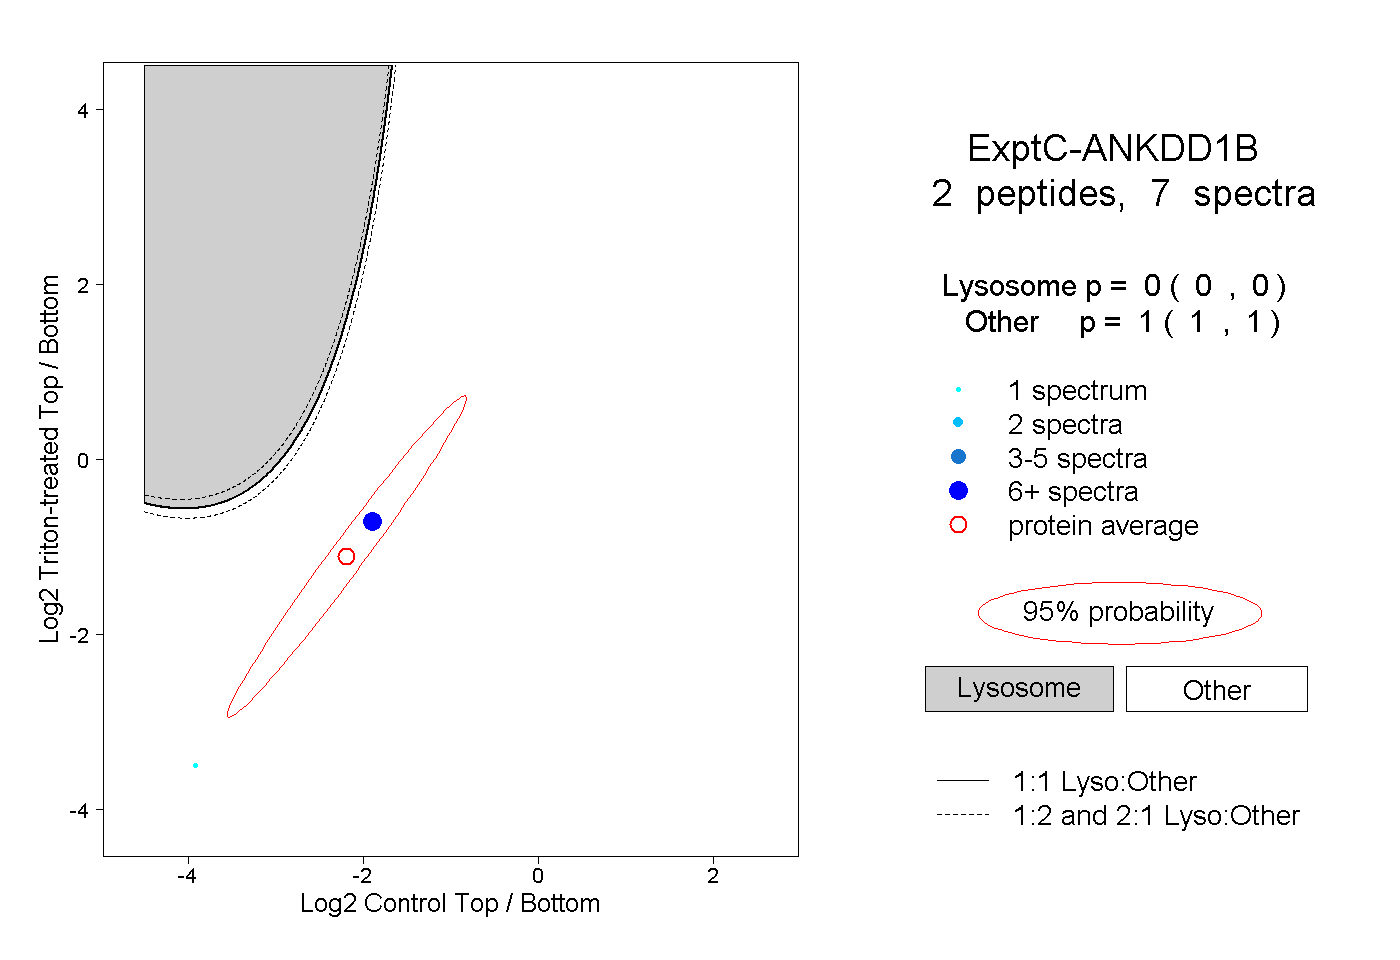 |
0.000 0.000 | 0.000 |
1.000 1.000 | 1.000 |
||||||||
| Plot | Lyso | Other | |||||||||||
| Expt D |
1 peptide |
1 spectrum |
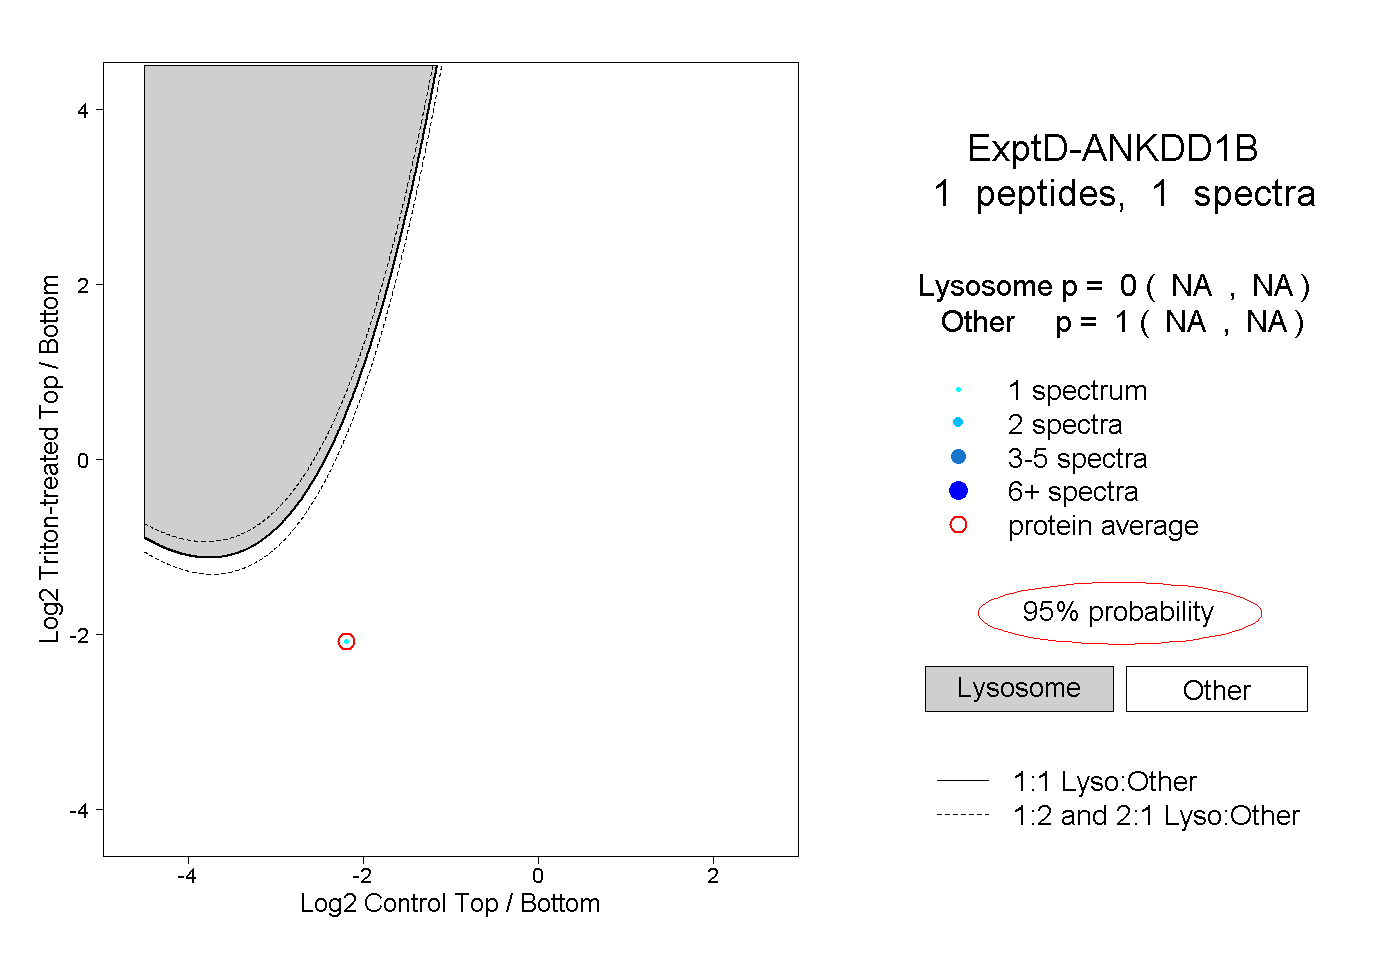 |
0.000 NA | NA |
1.000 NA | NA |