 2
2peptides
spectra

0.000 | 0.056
0.000 | 0.000
0.000 | 0.059
0.156 | 0.641
0.000 | 0.292
0.000 | 0.130
0.235 | 0.386
0.000 | 0.126
1peptide
spectra
NA | NA
NA | NA
| Plot | Mito | Lyso | Perox | ER | Golgi | PM | Cytosol | Nucleus | |||||
| Expt A |
2 peptides |
3 spectra |
|
0.000 0.000 | 0.056 |
0.000 0.000 | 0.000 |
0.000 0.000 | 0.059 |
0.619 0.156 | 0.641 |
0.000 0.000 | 0.292 |
0.000 0.000 | 0.130 |
0.333 0.235 | 0.386 |
0.048 0.000 | 0.126 |
||
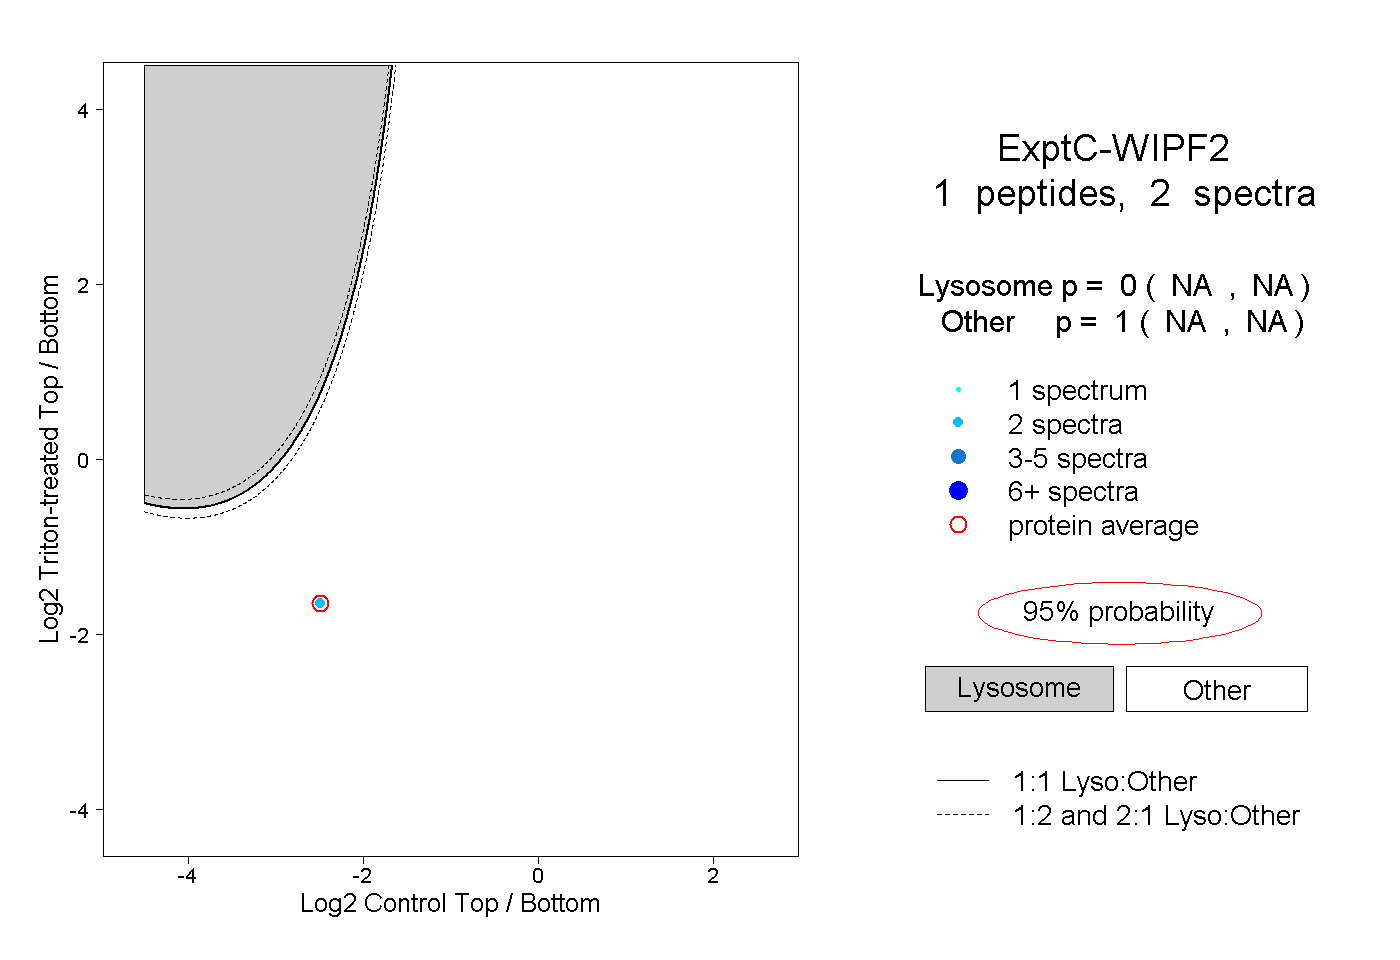
| Plot | Lyso | Other | |||||||||||
| Expt C |
1 peptide |
2 spectra |
|
0.000 NA | NA |
1.000 NA | NA |