 1
1peptide
spectra

NA | NA
NA | NA
NA | NA
NA | NA
NA | NA
NA | NA
NA | NA
NA | NA
1peptide
spectra
0.000 | 0.023
0.111 | 0.154
0.635 | 0.782
0.000 | 0.000
0.062 | 0.214
0.000 | 0.000
0.000 | 0.000
| Plot | Mito | Lyso | Perox | ER | Golgi | PM | Cytosol | Nucleus | |||||
| Expt A |
1 peptide |
2 spectra |
|
0.000 NA | NA |
0.000 NA | NA |
0.000 NA | NA |
0.812 NA | NA |
0.000 NA | NA |
0.000 NA | NA |
0.000 NA | NA |
0.188 NA | NA |
||
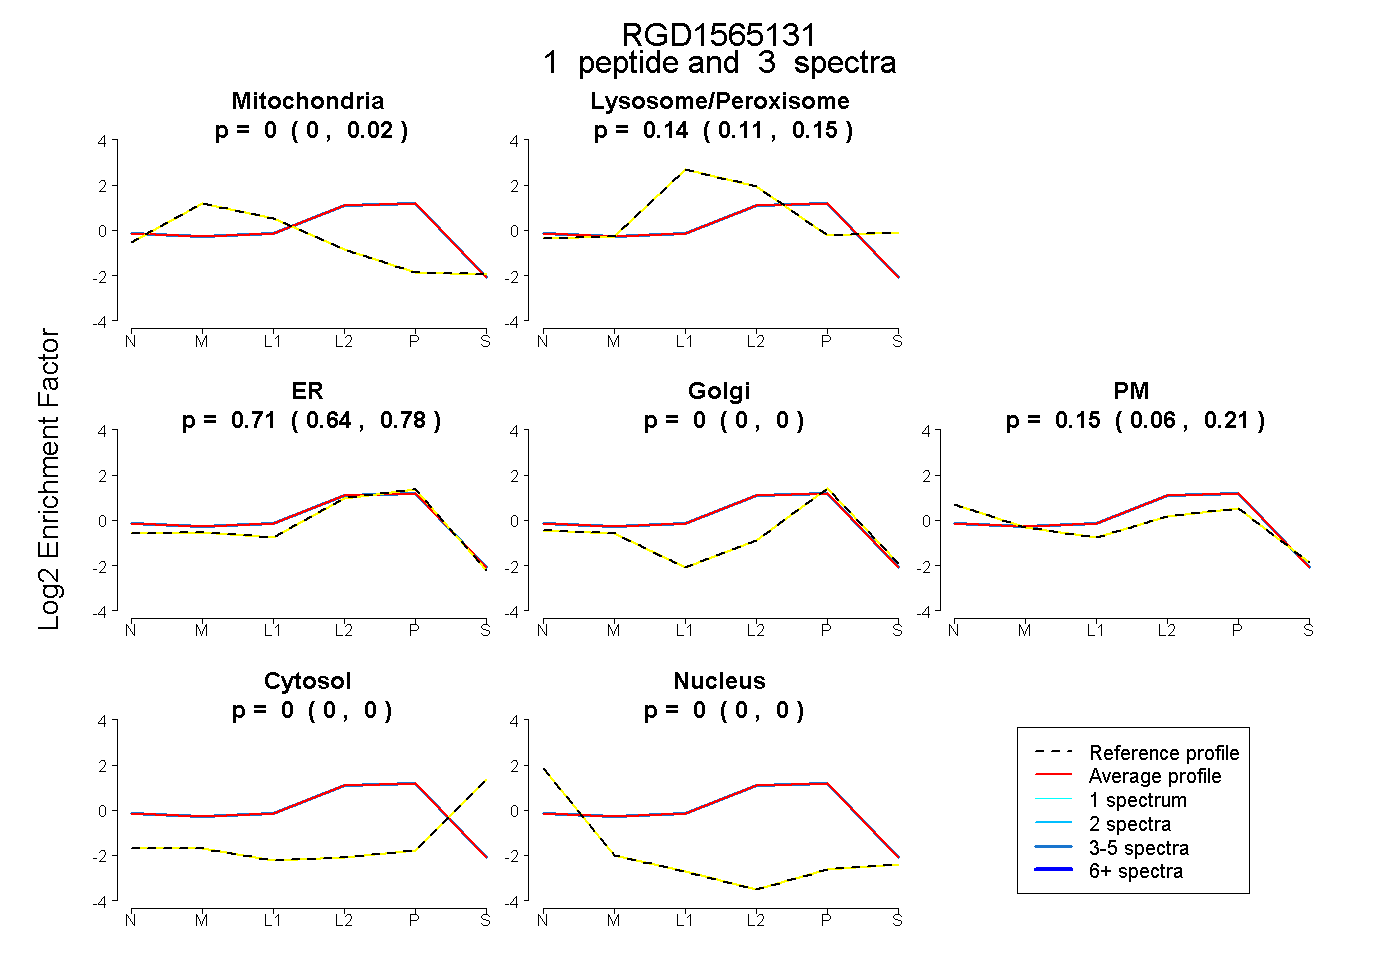
| Plot | Mito | Lyso or Perox | ER | Golgi | PM | Cytosol | Nucleus | ||||||
| Expt B |
1 peptide |
3 spectra |
|
0.000 0.000 | 0.023 |
0.136 0.111 | 0.154 |
0.710 0.635 | 0.782 |
0.000 0.000 | 0.000 |
0.154 0.062 | 0.214 |
0.000 0.000 | 0.000 |
0.000 0.000 | 0.000 |