 3
3peptides
spectra
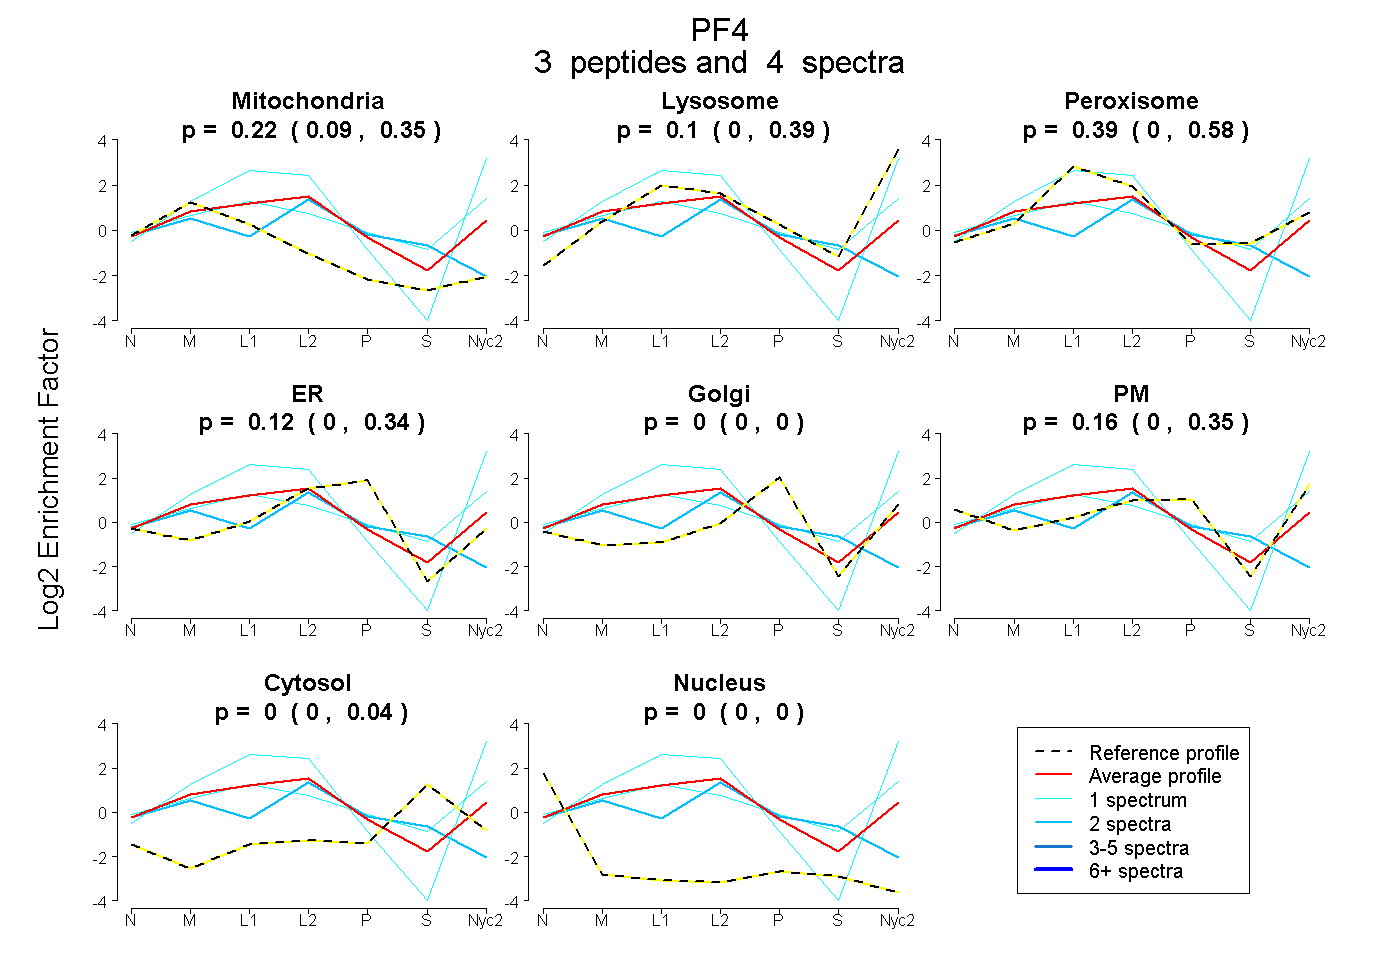
0.094 | 0.352
0.000 | 0.394
0.000 | 0.575
0.000 | 0.343
0.000 | 0.000
0.000 | 0.346
0.000 | 0.038
0.000 | 0.000
2peptides
spectra
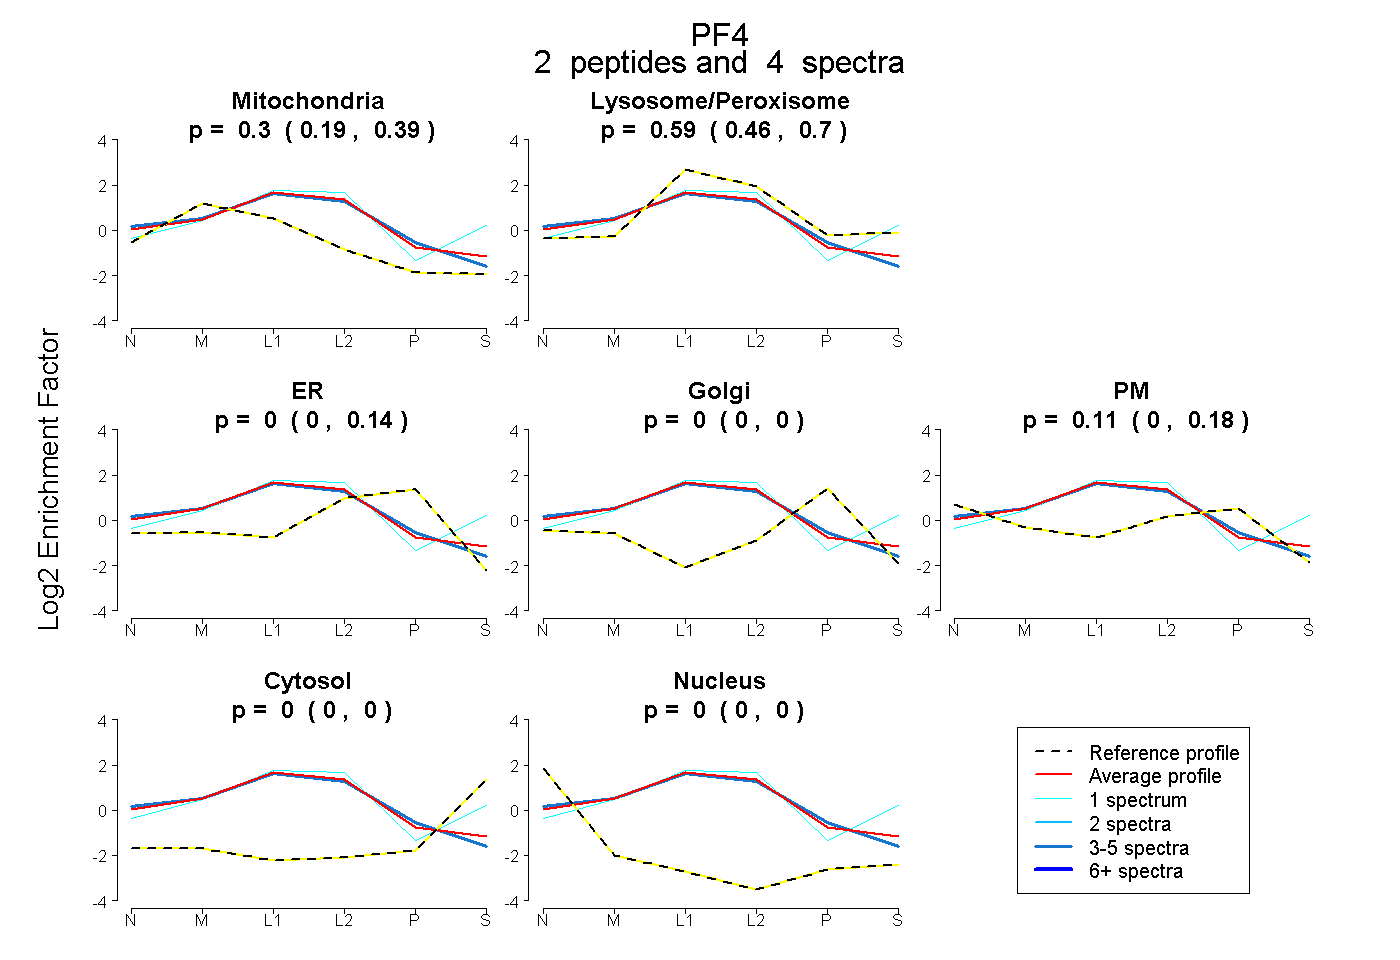
0.190 | 0.389
0.459 | 0.702
0.000 | 0.141
0.000 | 0.000
0.000 | 0.182
0.000 | 0.000
0.000 | 0.000
3peptides
spectra
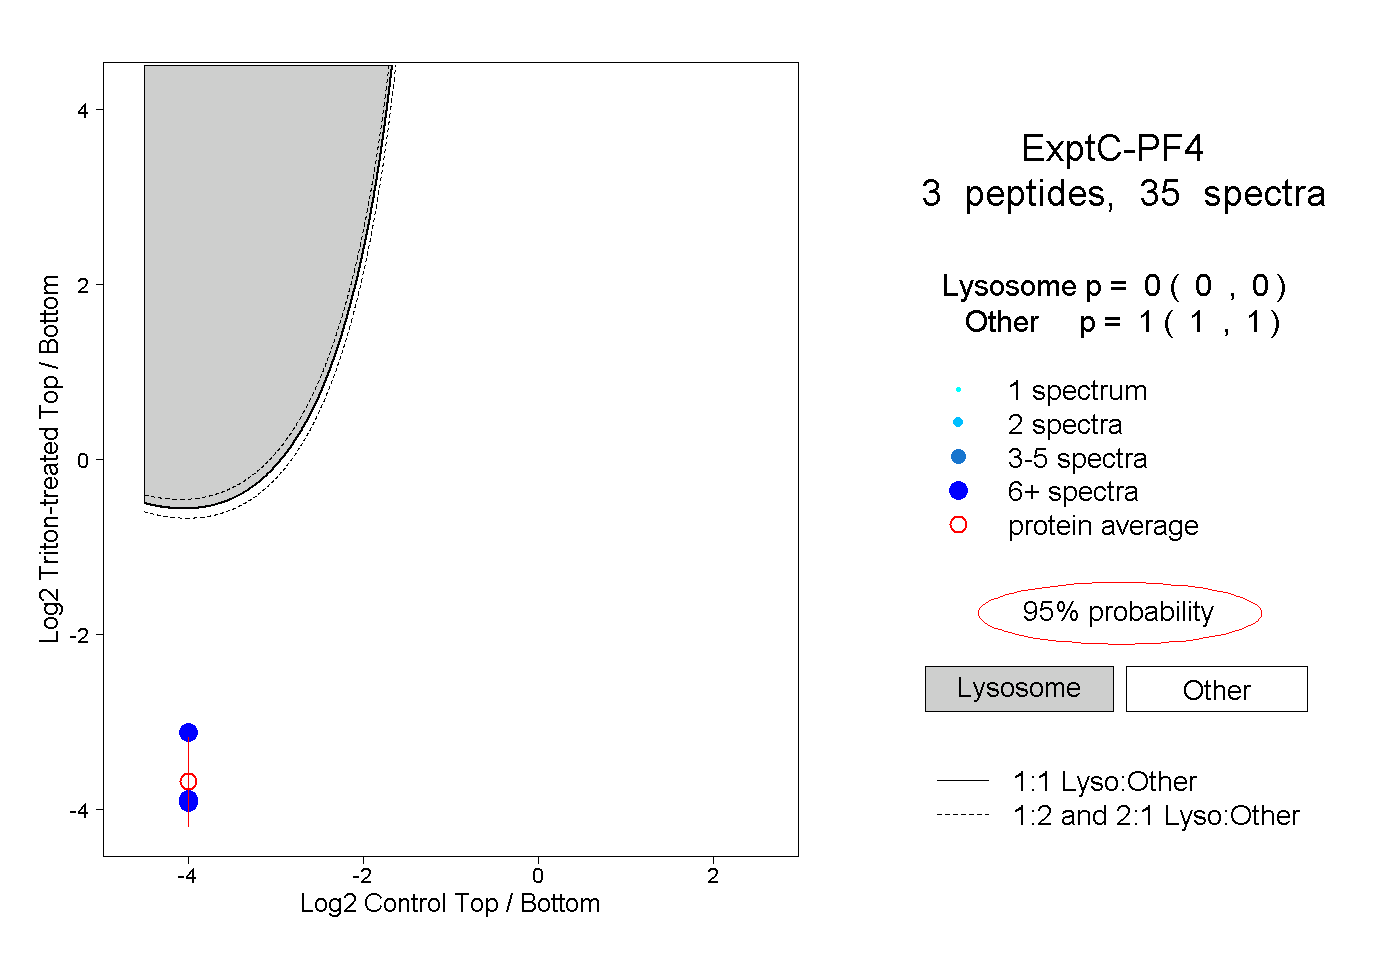
0.000 | 0.000
1.000 | 1.000
2peptides
spectra
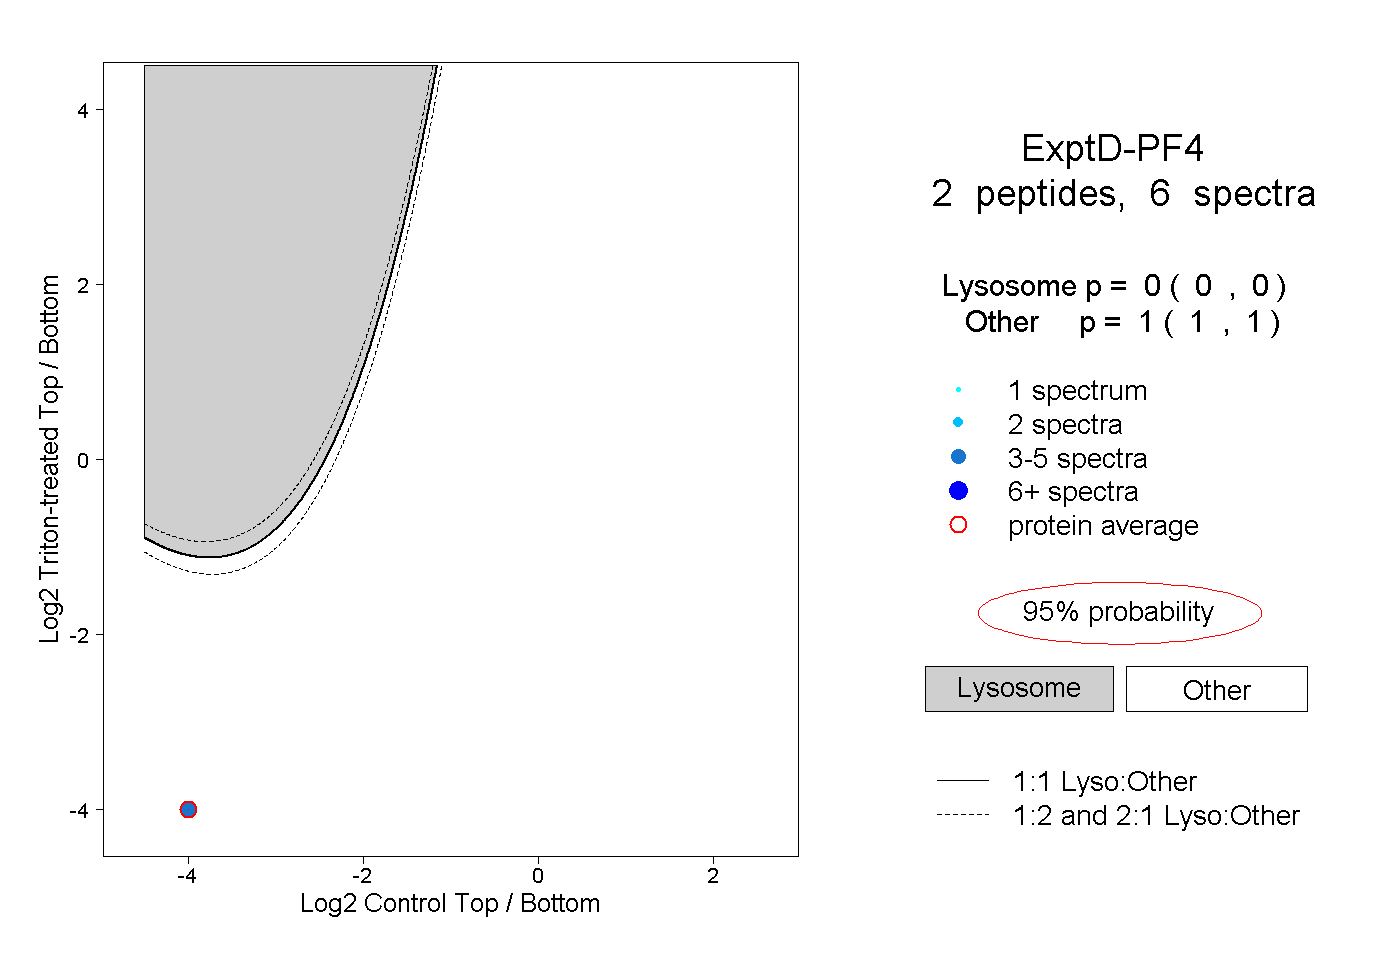
0.000 | 0.000
1.000 | 1.000