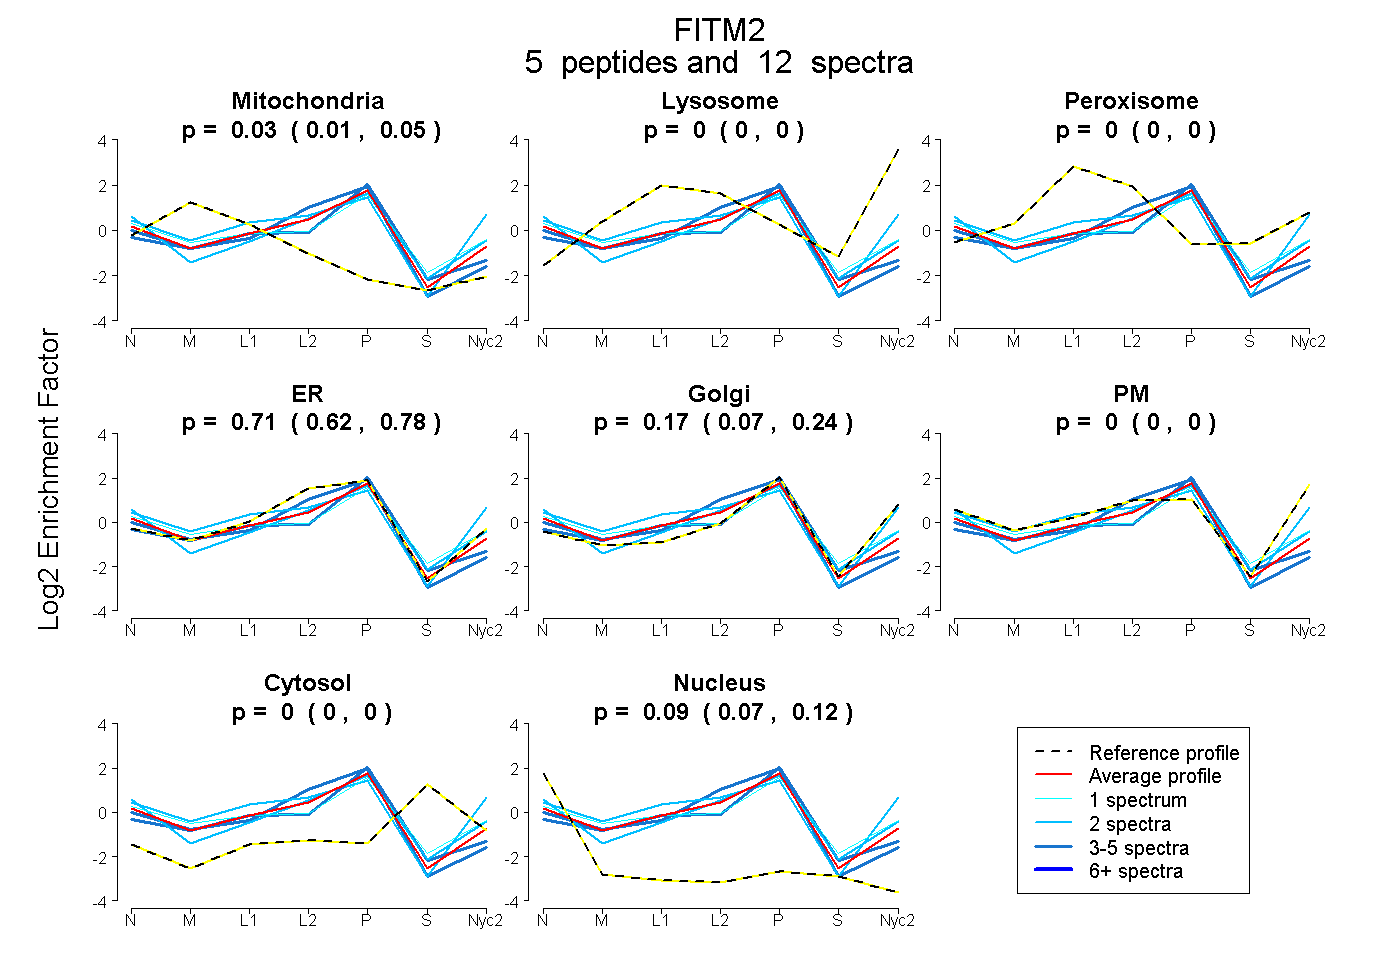
 5
5peptides
spectra
0.009 | 0.054
0.000 | 0.000
0.000 | 0.000
0.619 | 0.776
0.074 | 0.242
0.000 | 0.000
0.000 | 0.000
0.071 | 0.115
| Plot | Mito | Lyso | Perox | ER | Golgi | PM | Cytosol | Nucleus | |||||
| Expt A |
5 peptides |
12 spectra |
|
0.034 0.009 | 0.054 |
0.000 0.000 | 0.000 |
0.000 0.000 | 0.000 |
0.705 0.619 | 0.776 |
0.167 0.074 | 0.242 |
0.000 0.000 | 0.000 |
0.000 0.000 | 0.000 |
0.094 0.071 | 0.115 |
| 4 spectra, CAWFLR | 0.000 | 0.000 | 0.000 | 0.881 | 0.000 | 0.000 | 0.000 | 0.119 | ||
| 2 spectra, NVLNVYFVK | 0.000 | 0.000 | 0.000 | 0.585 | 0.200 | 0.068 | 0.025 | 0.122 | ||
| 2 spectra, ELSPLPESYLSNK | 0.061 | 0.000 | 0.000 | 0.317 | 0.078 | 0.540 | 0.000 | 0.004 | ||
| 1 spectrum, SFSPGLPPQSSSLTLK | 0.071 | 0.000 | 0.105 | 0.271 | 0.473 | 0.000 | 0.000 | 0.079 | ||
| 3 spectra, MEHLER | 0.052 | 0.000 | 0.000 | 0.627 | 0.189 | 0.000 | 0.035 | 0.097 |
| Plot | Mito | Lyso or Perox | ER | Golgi | PM | Cytosol | Nucleus | ||||||
| Expt B |
1 peptide |
1 spectrum |
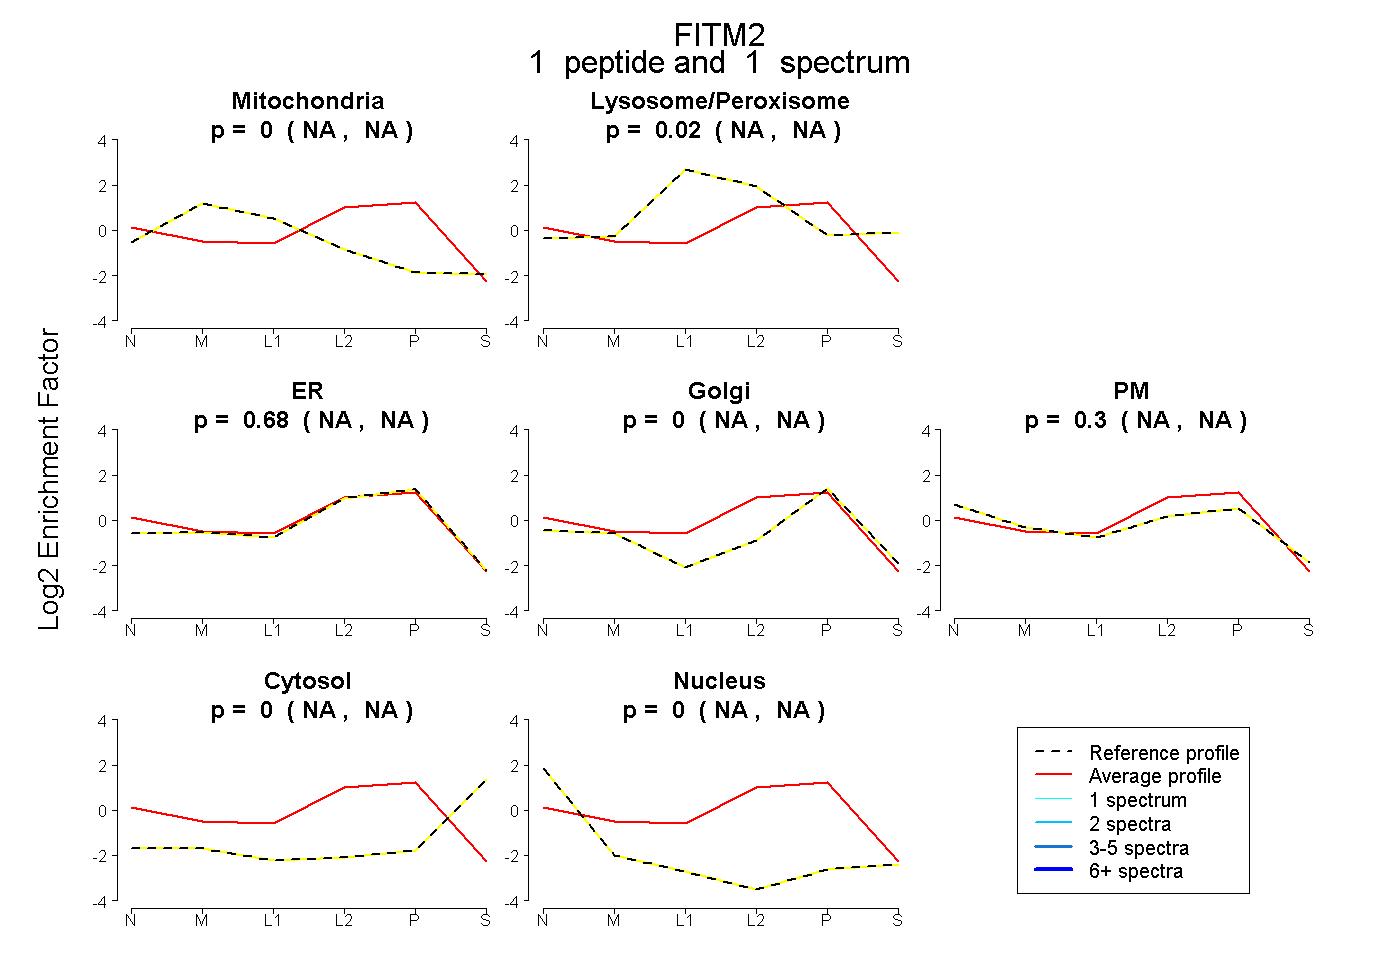 |
0.000 NA | NA |
0.021 NA | NA |
0.676 NA | NA |
0.000 NA | NA |
0.304 NA | NA |
0.000 NA | NA |
0.000 NA | NA |
|||
| Plot | Lyso | Other | |||||||||||
| Expt C |
3 peptides |
5 spectra |
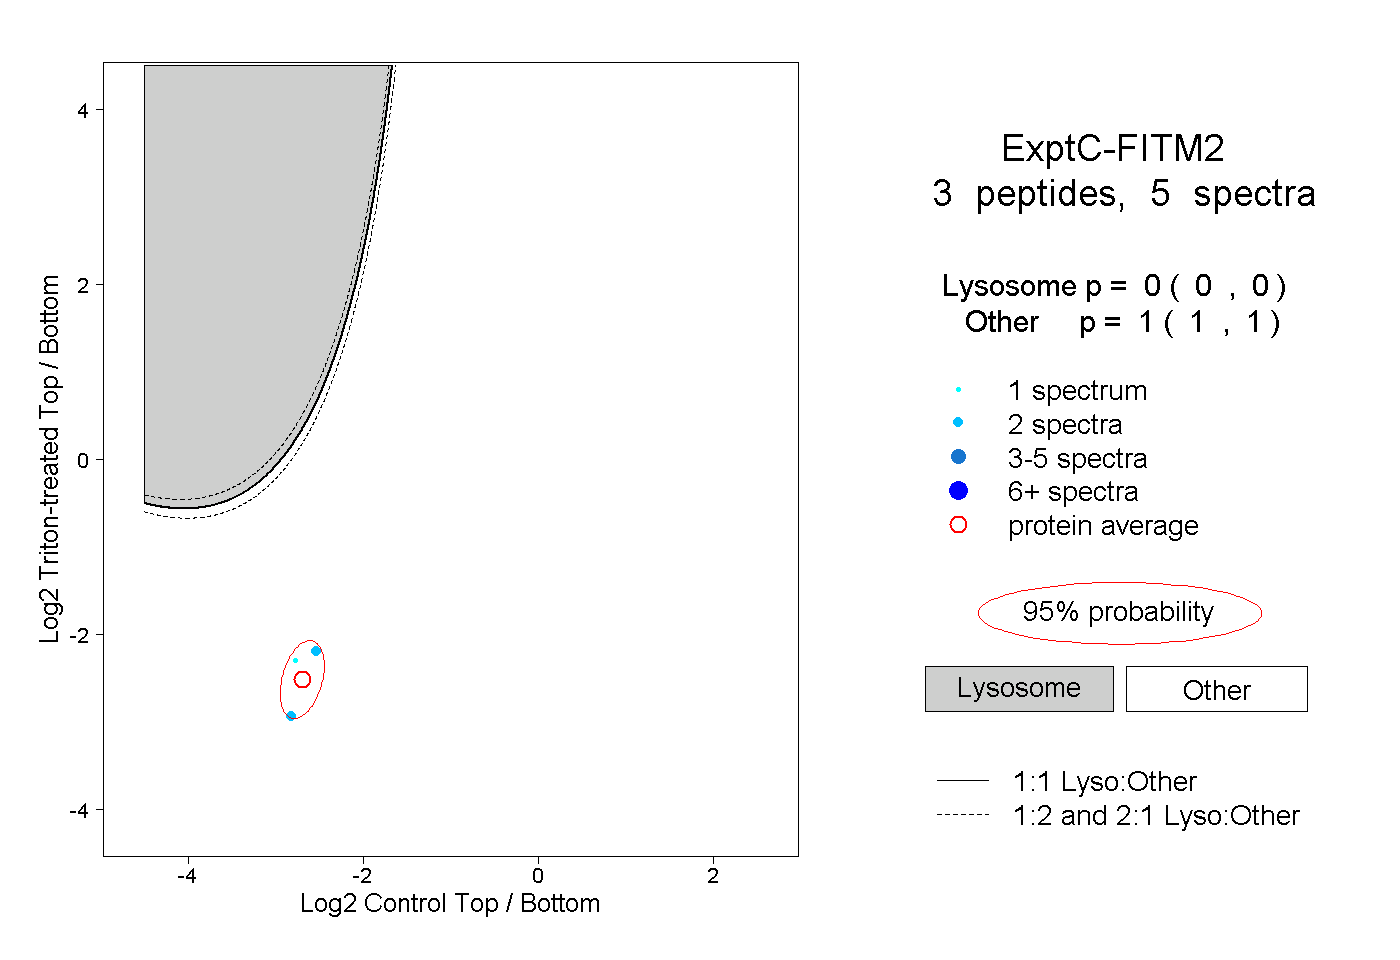 |
0.000 0.000 | 0.000 |
1.000 1.000 | 1.000 |