 9
9peptides
spectra
0.477 | 0.512
0.174 | 0.228
0.261 | 0.323
0.000 | 0.000
0.000 | 0.000
0.000 | 0.027
0.000 | 0.000
0.000 | 0.000
2peptides
spectra
NA | NA
NA | NA
NA | NA
NA | NA
NA | NA
NA | NA
NA | NA
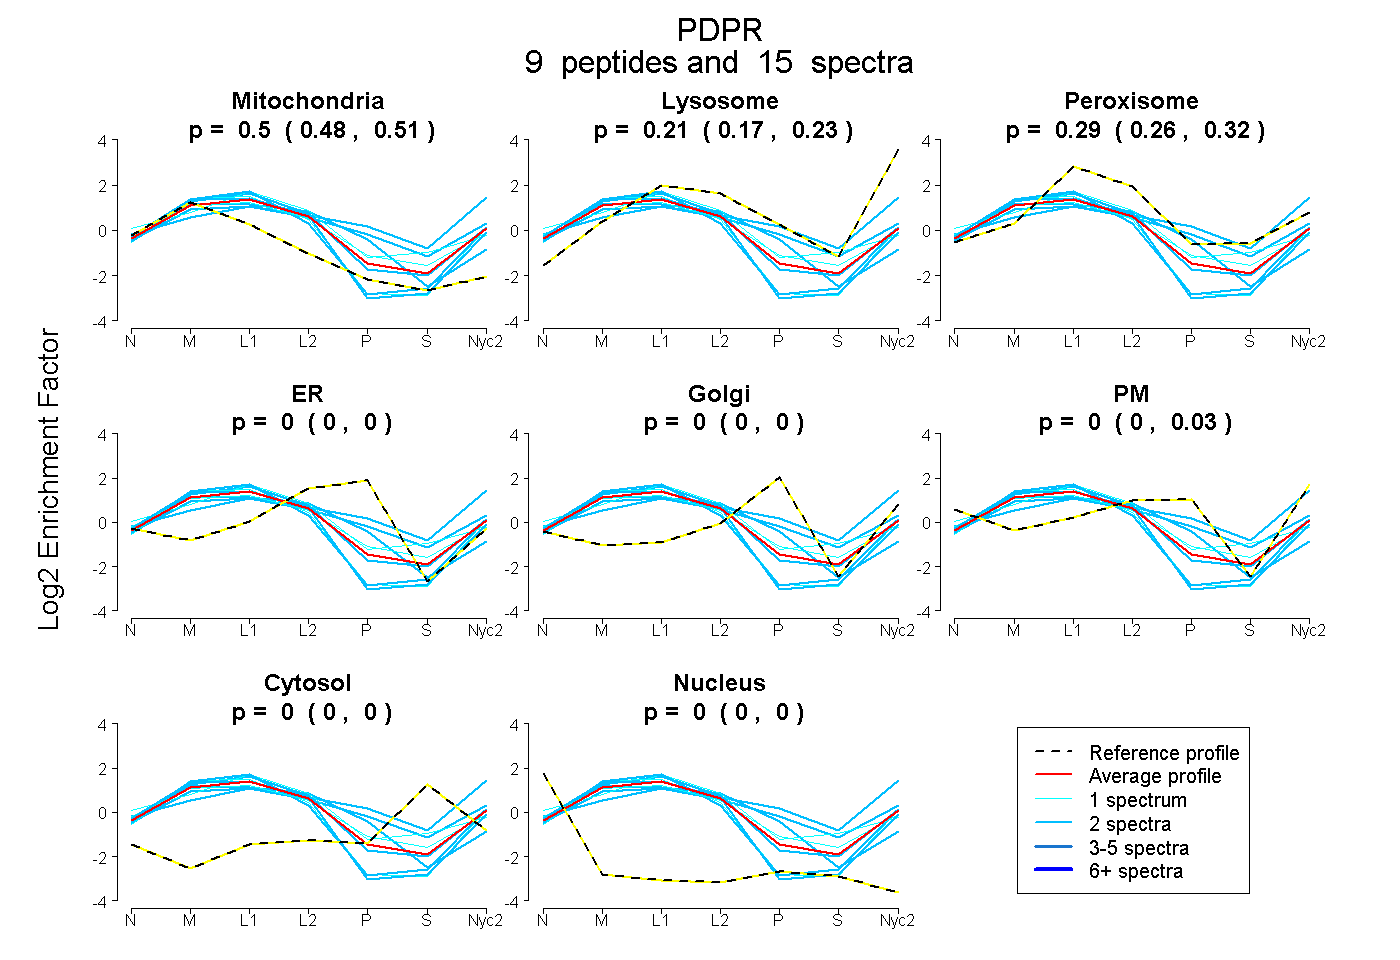
| Plot | Mito | Lyso | Perox | ER | Golgi | PM | Cytosol | Nucleus | |||||
| Expt A |
9 peptides |
15 spectra |
|
0.499 0.477 | 0.512 |
0.207 0.174 | 0.228 |
0.294 0.261 | 0.323 |
0.000 0.000 | 0.000 |
0.000 0.000 | 0.000 |
0.000 0.000 | 0.027 |
0.000 0.000 | 0.000 |
0.000 0.000 | 0.000 |
||
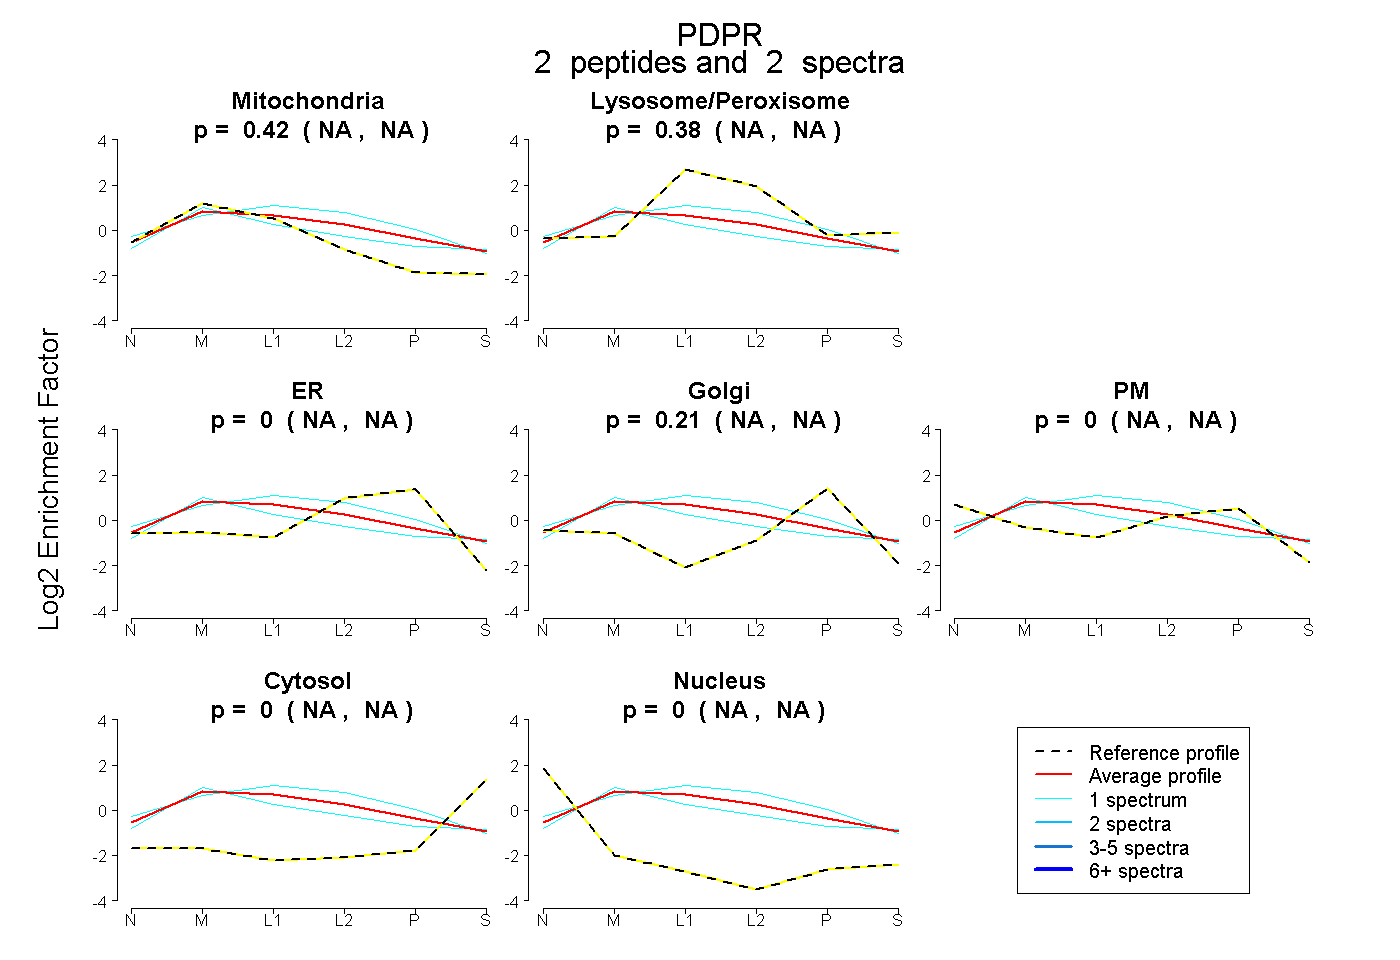
| Plot | Mito | Lyso or Perox | ER | Golgi | PM | Cytosol | Nucleus | ||||||
| Expt B |
2 peptides |
2 spectra |
|
0.416 NA | NA |
0.375 NA | NA |
0.000 NA | NA |
0.209 NA | NA |
0.000 NA | NA |
0.000 NA | NA |
0.000 NA | NA |
| 1 spectrum, YTALNLIGPR | 0.536 | 0.227 | 0.000 | 0.154 | 0.000 | 0.083 | 0.000 | |||
| 1 spectrum, LNVVGIPSEIISPK | 0.276 | 0.442 | 0.163 | 0.026 | 0.093 | 0.000 | 0.000 |
| Plot | Lyso | Other | |||||||||||
| Expt C |
24 peptides |
75 spectra |
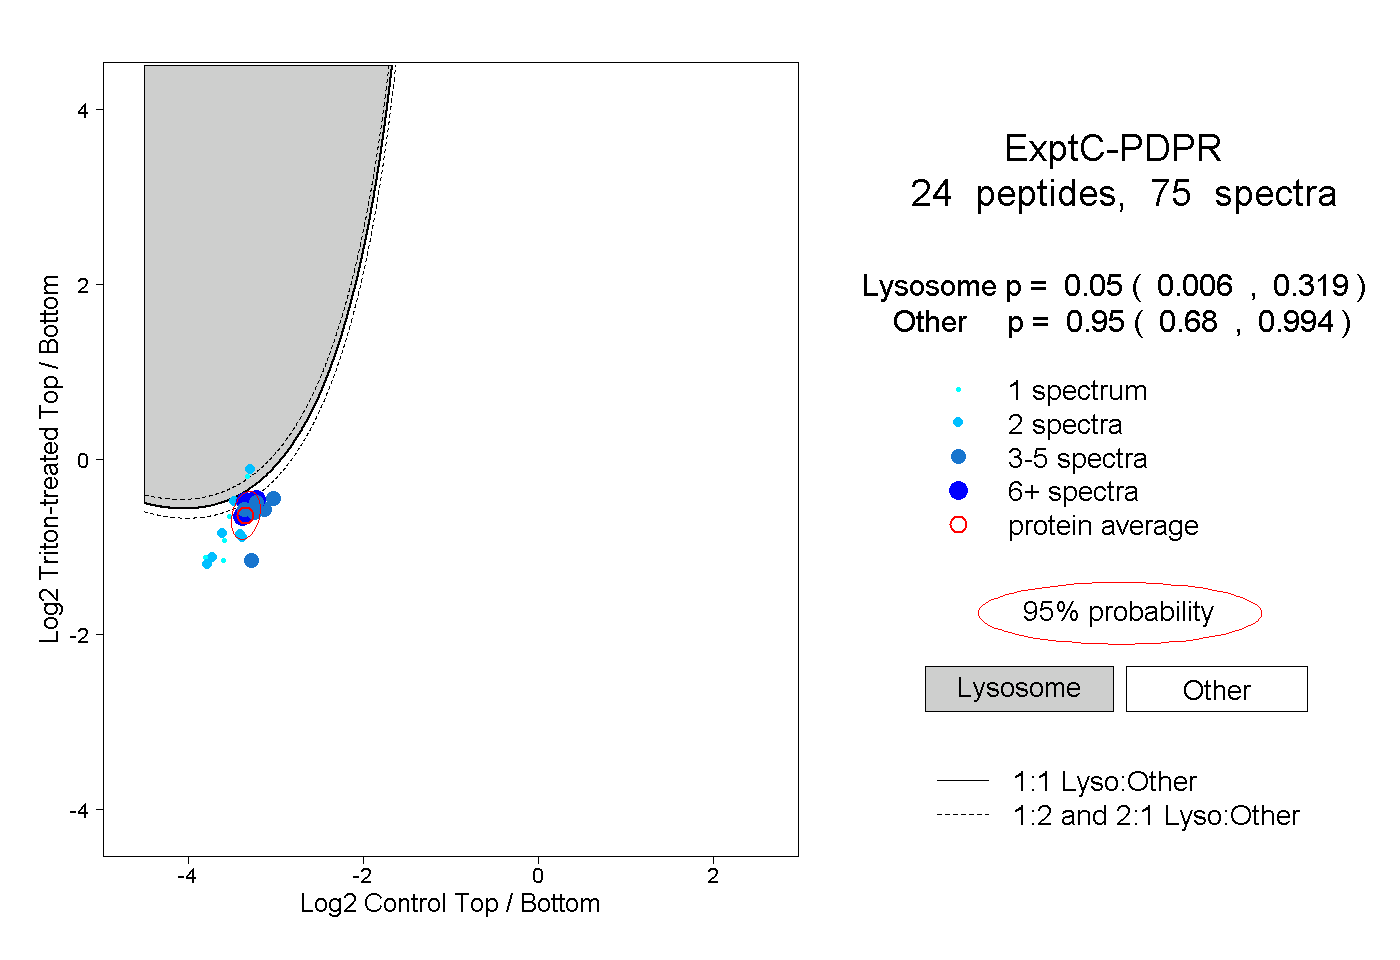 |
0.050 0.006 | 0.319 |
0.950 0.680 | 0.994 |
||||||||
| Plot | Lyso | Other | |||||||||||
| Expt D |
5 peptides |
6 spectra |
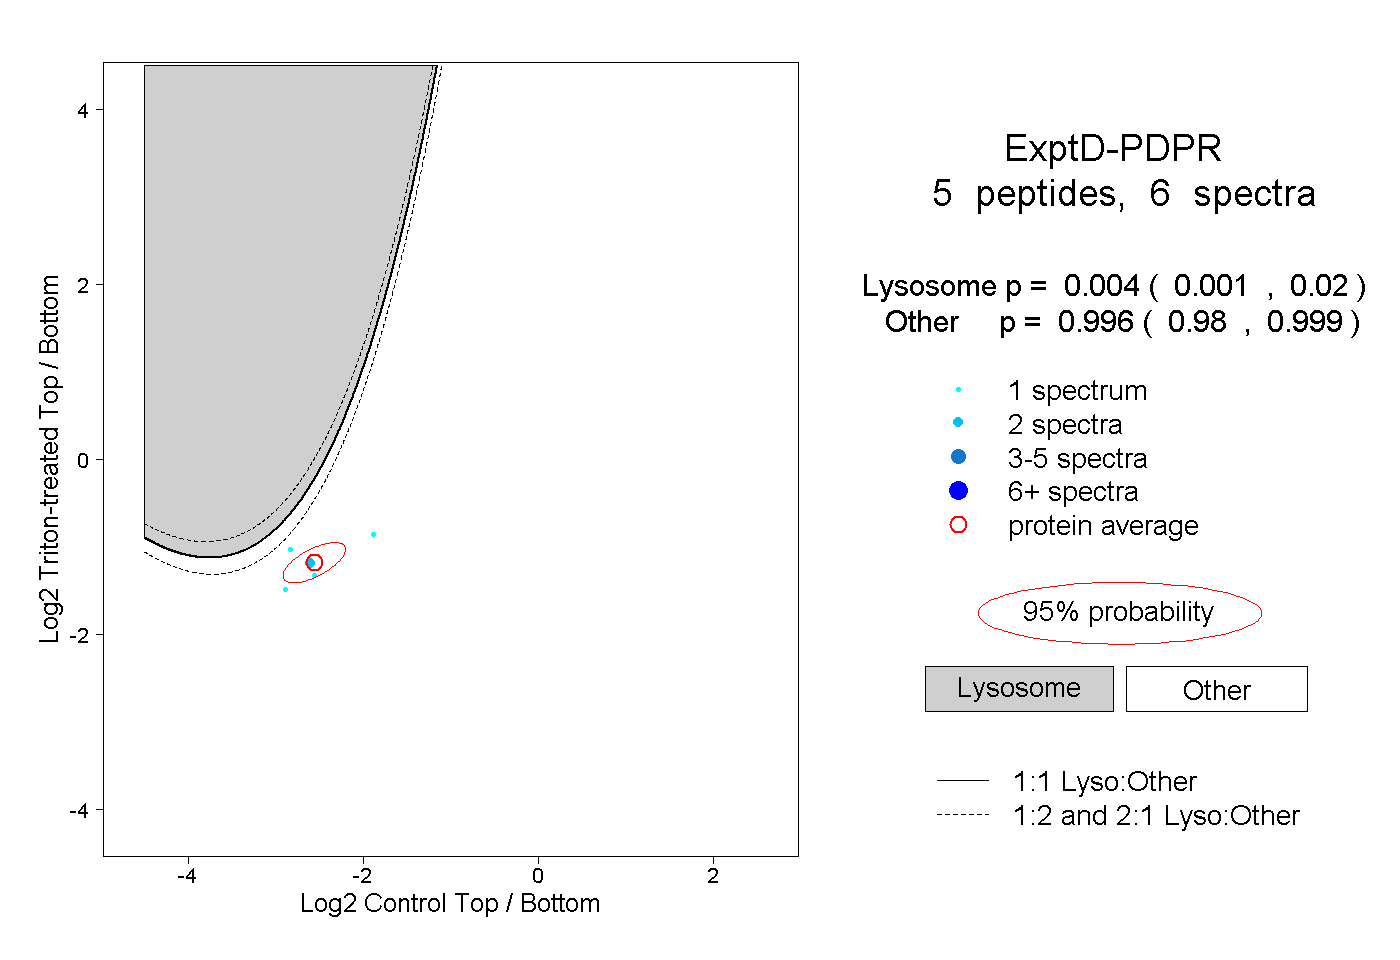 |
0.004 0.001 | 0.020 |
0.996 0.980 | 0.999 |