 9
9peptides
spectra
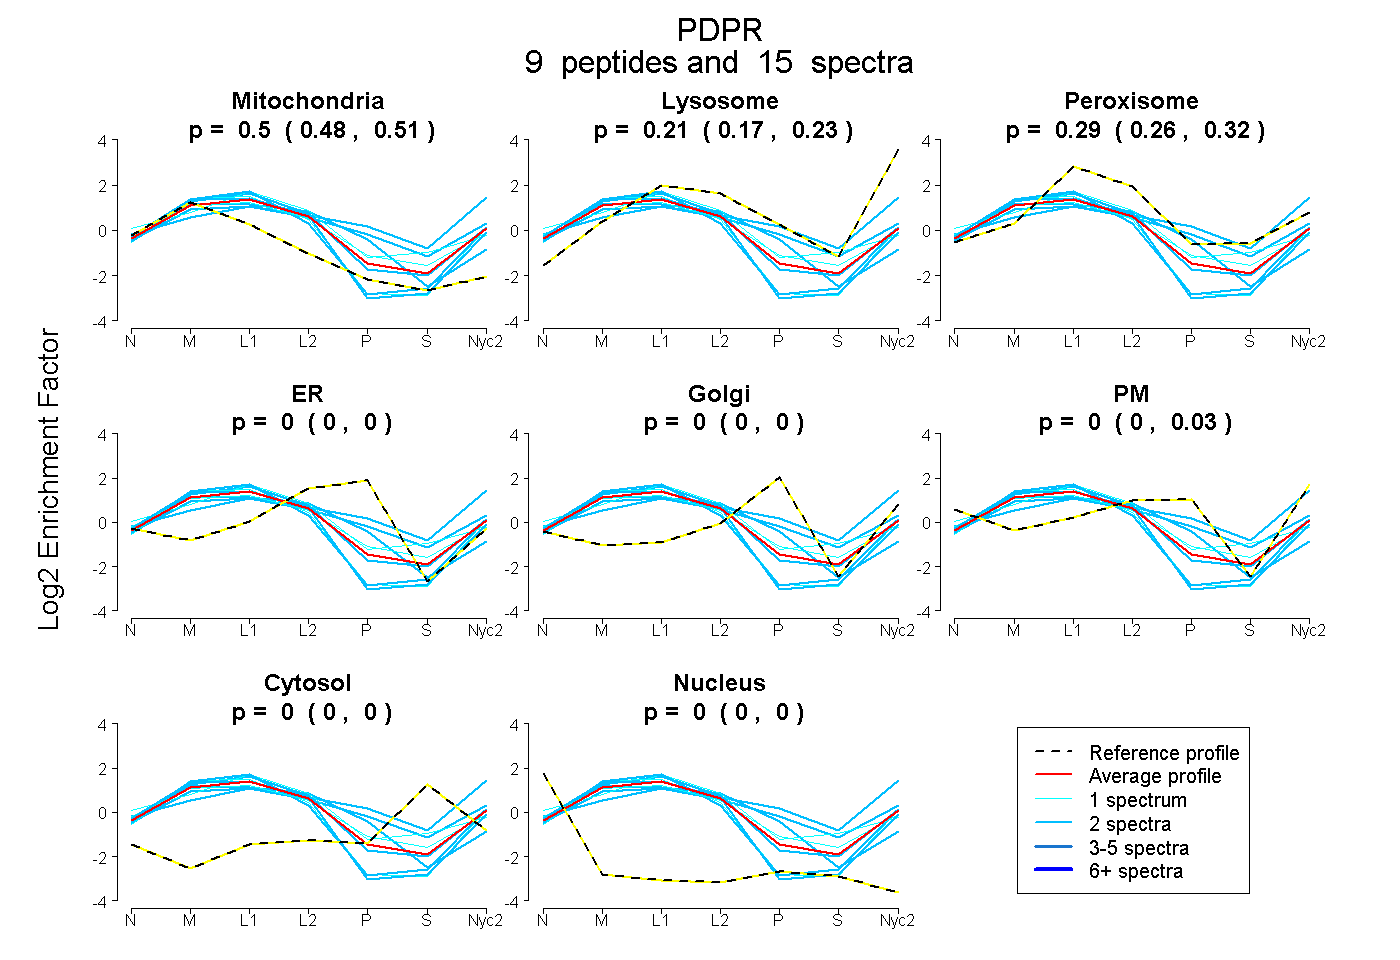
0.477 | 0.512
0.174 | 0.228
0.261 | 0.323
0.000 | 0.000
0.000 | 0.000
0.000 | 0.027
0.000 | 0.000
0.000 | 0.000
2peptides
spectra
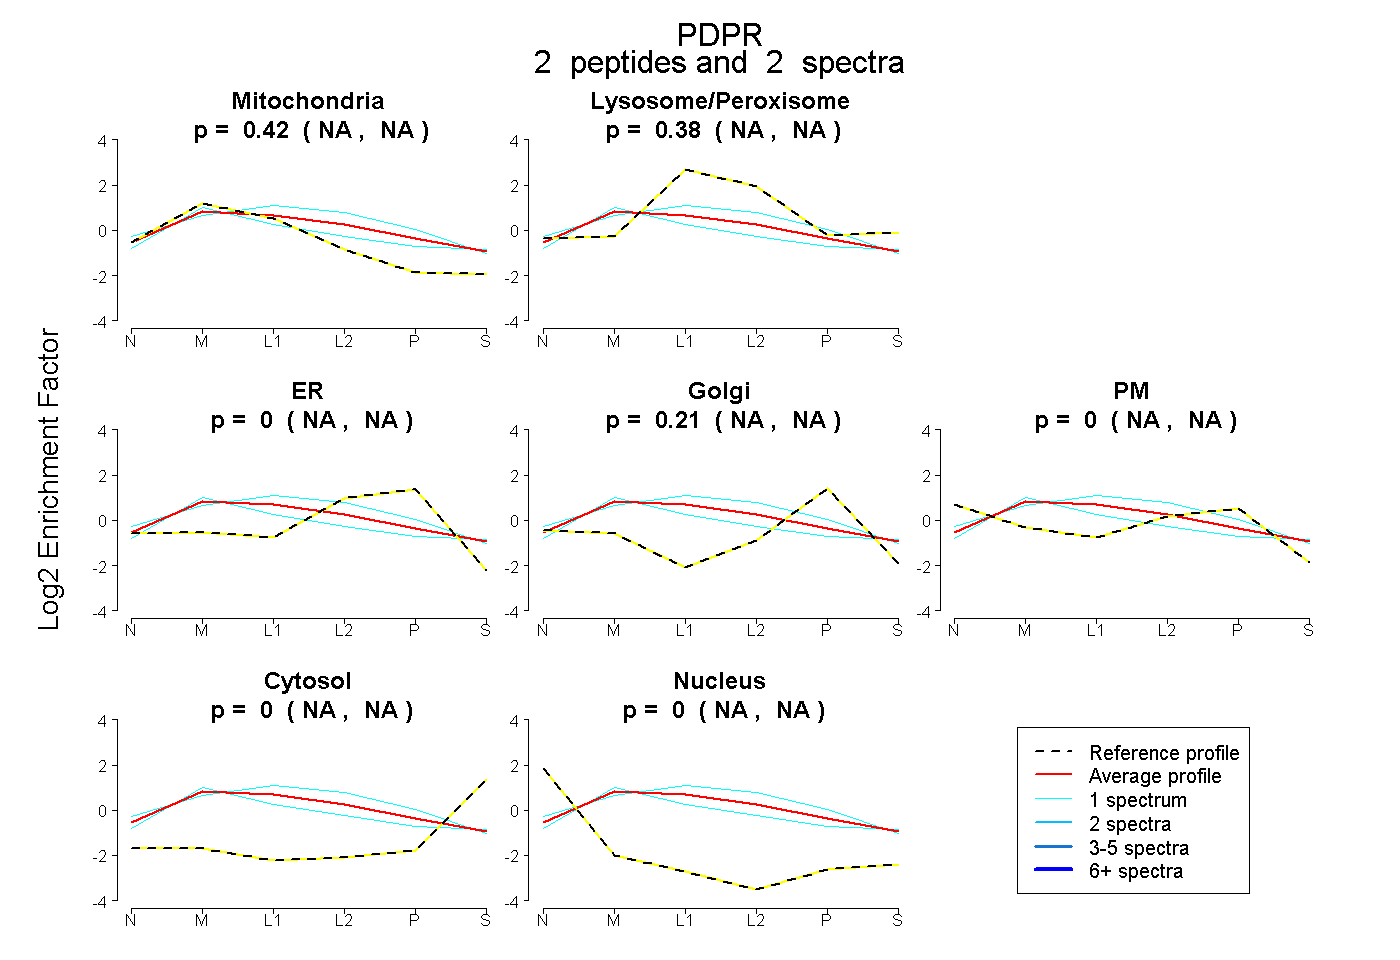
NA | NA
NA | NA
NA | NA
NA | NA
NA | NA
NA | NA
NA | NA
24peptides
spectra
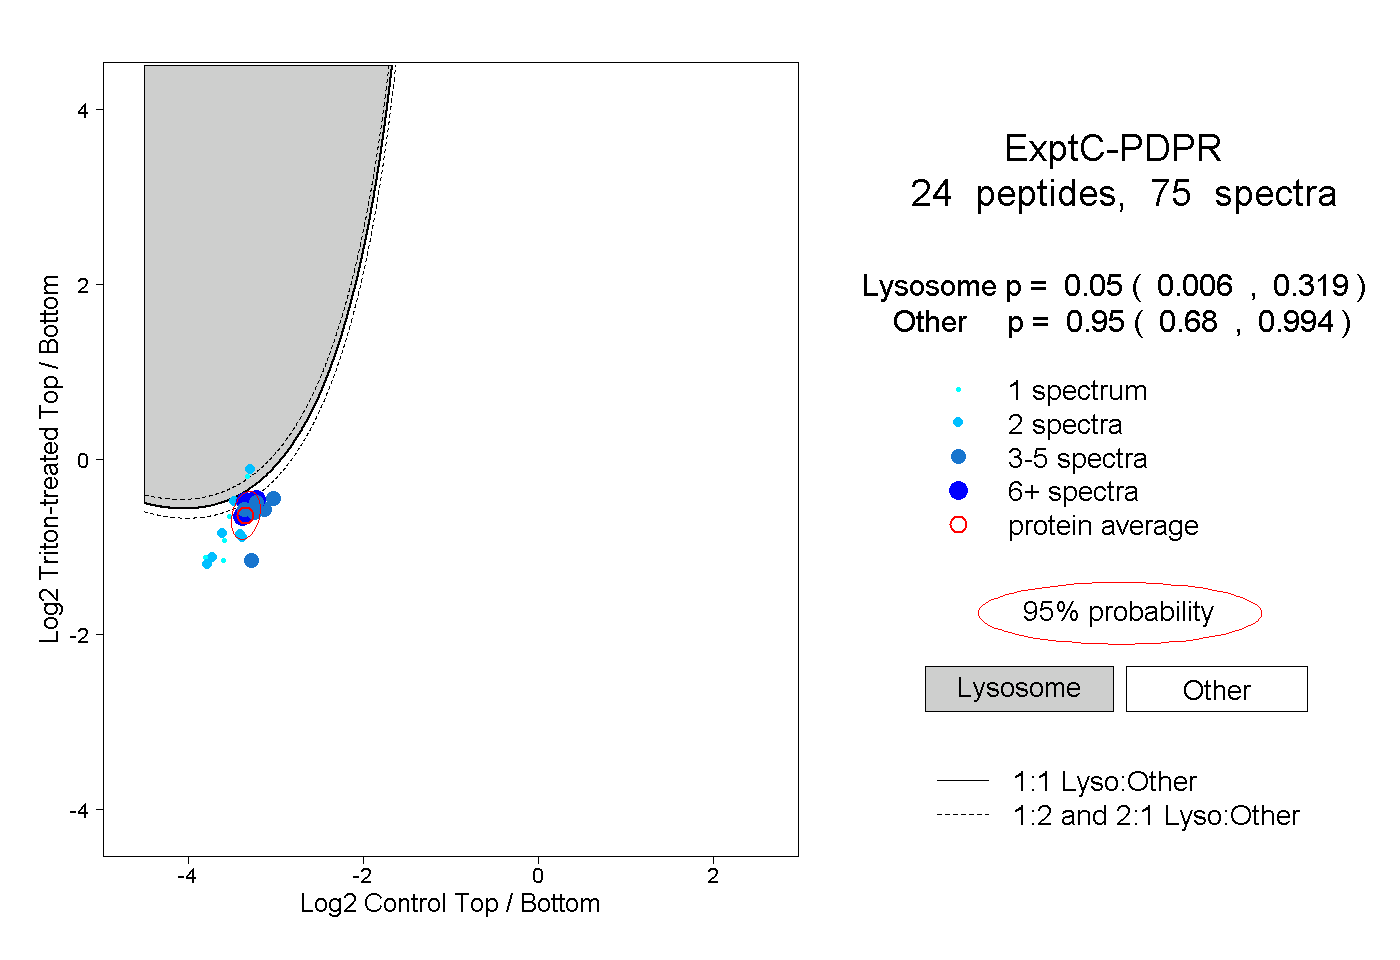
0.006 | 0.319
0.680 | 0.994
5peptides
spectra
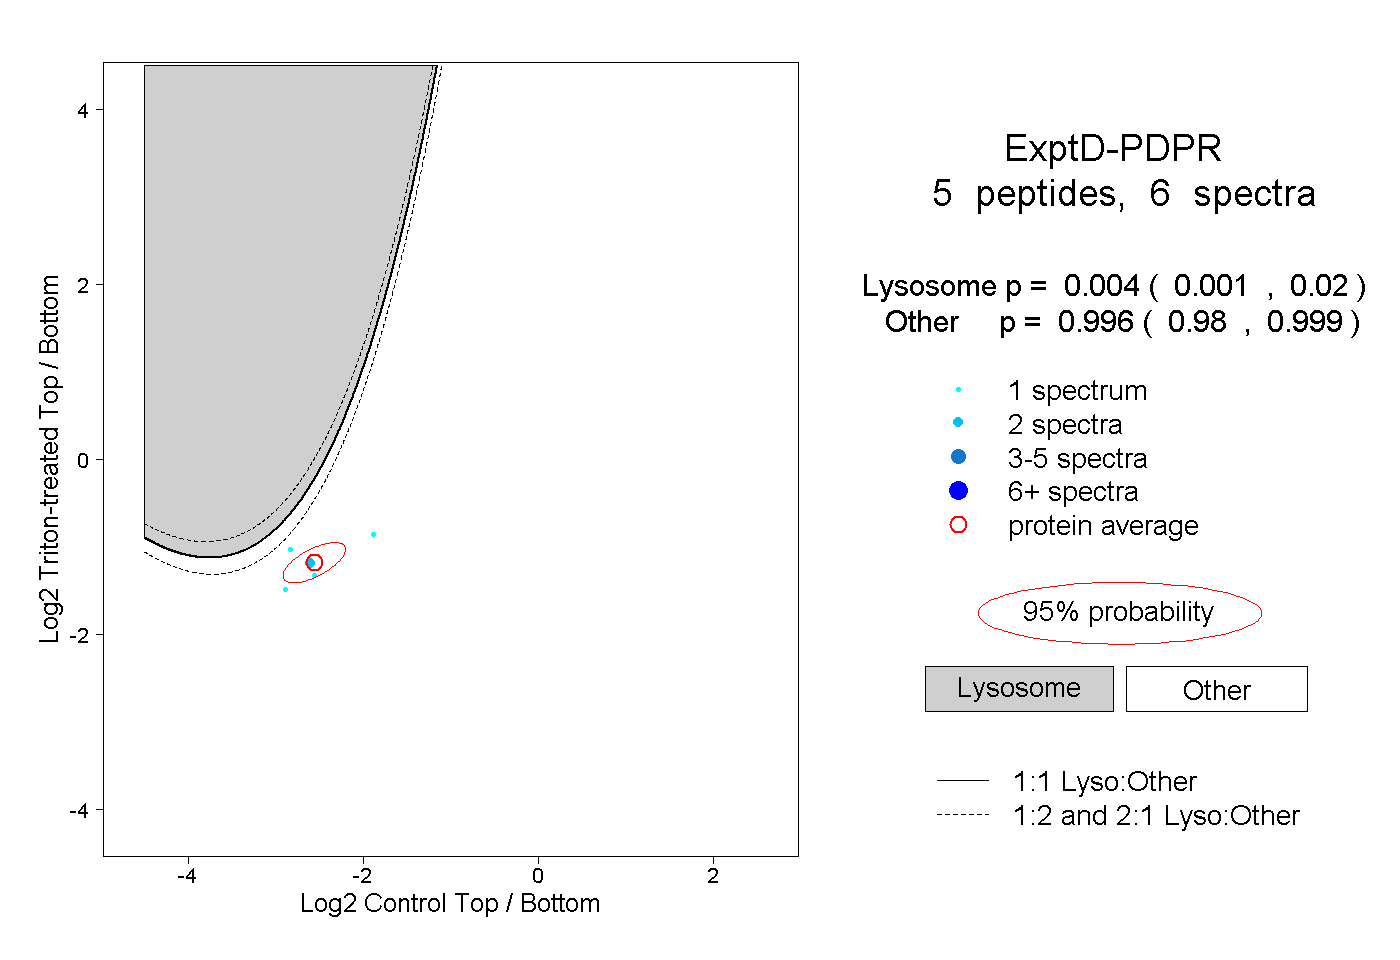
0.001 | 0.020
0.980 | 0.999