 8
8peptides
spectra
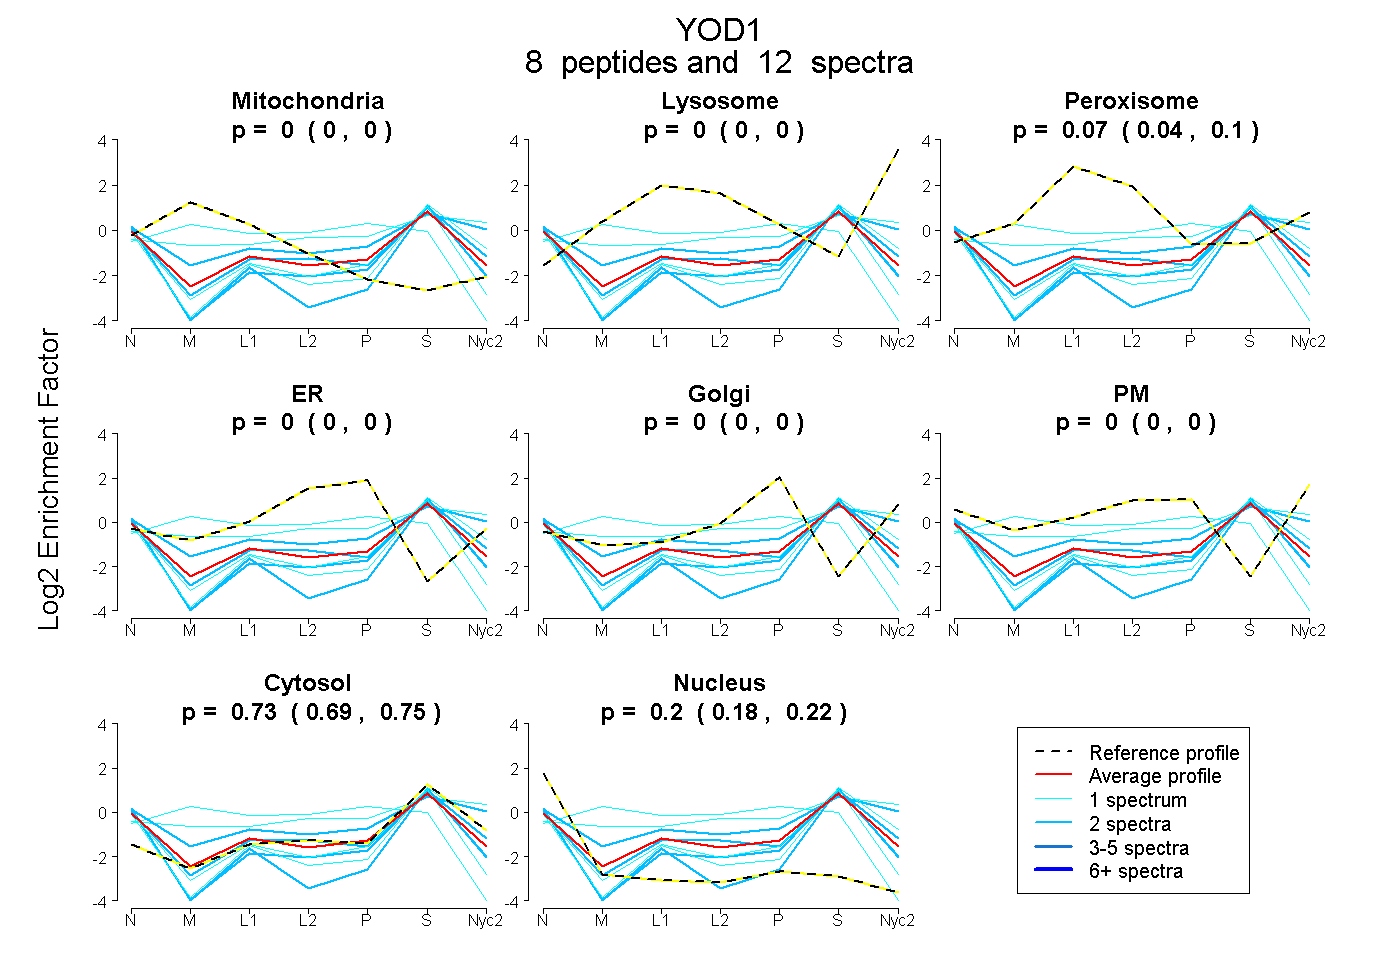
0.000 | 0.000
0.000 | 0.000
0.042 | 0.099
0.000 | 0.000
0.000 | 0.000
0.000 | 0.000
0.692 | 0.753
0.178 | 0.220
| Plot | Mito | Lyso | Perox | ER | Golgi | PM | Cytosol | Nucleus | |||||
| Expt A |
8 peptides |
12 spectra |
|
0.000 0.000 | 0.000 |
0.000 0.000 | 0.000 |
0.073 0.042 | 0.099 |
0.000 0.000 | 0.000 |
0.000 0.000 | 0.000 |
0.000 0.000 | 0.000 |
0.726 0.692 | 0.753 |
0.201 0.178 | 0.220 |
| 1 spectrum, VLLIYDGIHYDPLQR | 0.000 | 0.000 | 0.000 | 0.000 | 0.000 | 0.000 | 0.811 | 0.189 | ||
| 1 spectrum, ELQGQIAAITGIAPGSQR | 0.455 | 0.000 | 0.000 | 0.230 | 0.000 | 0.000 | 0.315 | 0.000 | ||
| 2 spectra, ETLPVLTR | 0.000 | 0.000 | 0.000 | 0.000 | 0.000 | 0.000 | 0.722 | 0.278 | ||
| 1 spectrum, GGTHVLQGLSNR | 0.000 | 0.069 | 0.107 | 0.000 | 0.000 | 0.258 | 0.567 | 0.000 | ||
| 2 spectra, QFTDVNR | 0.000 | 0.000 | 0.045 | 0.000 | 0.000 | 0.259 | 0.667 | 0.030 | ||
| 2 spectra, GLTGQAEAR | 0.000 | 0.000 | 0.000 | 0.000 | 0.000 | 0.000 | 0.641 | 0.359 | ||
| 1 spectrum, TNEEYCDWIR | 0.000 | 0.000 | 0.000 | 0.000 | 0.000 | 0.000 | 0.709 | 0.291 | ||
| 2 spectra, ETGHTNFGEV | 0.000 | 0.000 | 0.058 | 0.000 | 0.000 | 0.000 | 0.774 | 0.168 |
| Plot | Lyso | Other | |||||||||||
| Expt C |
2 peptides |
8 spectra |
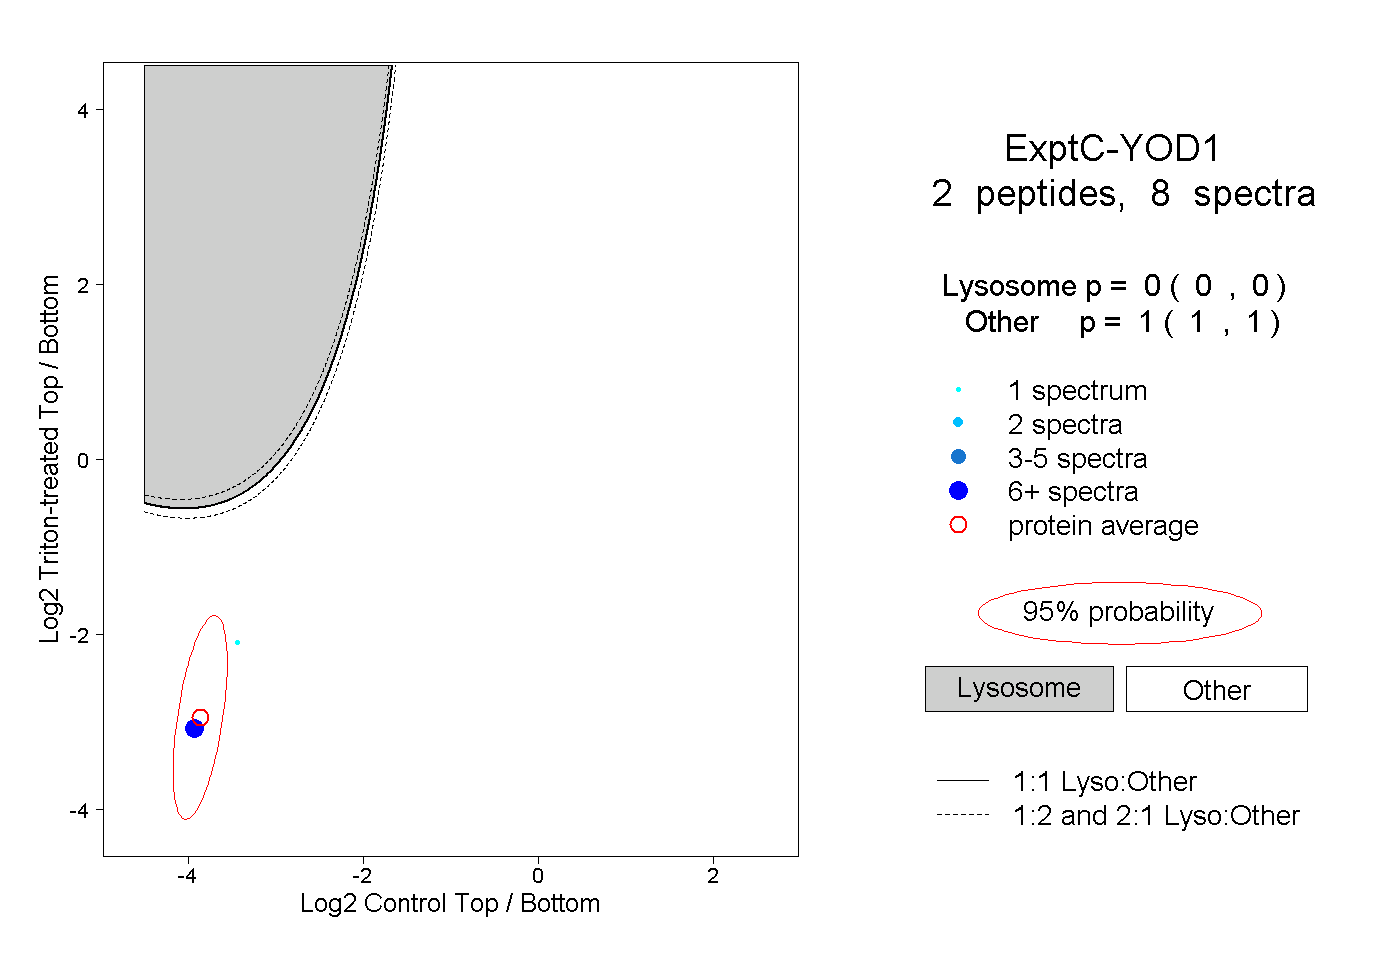 |
0.000 0.000 | 0.000 |
1.000 1.000 | 1.000 |