 13
13peptides
spectra
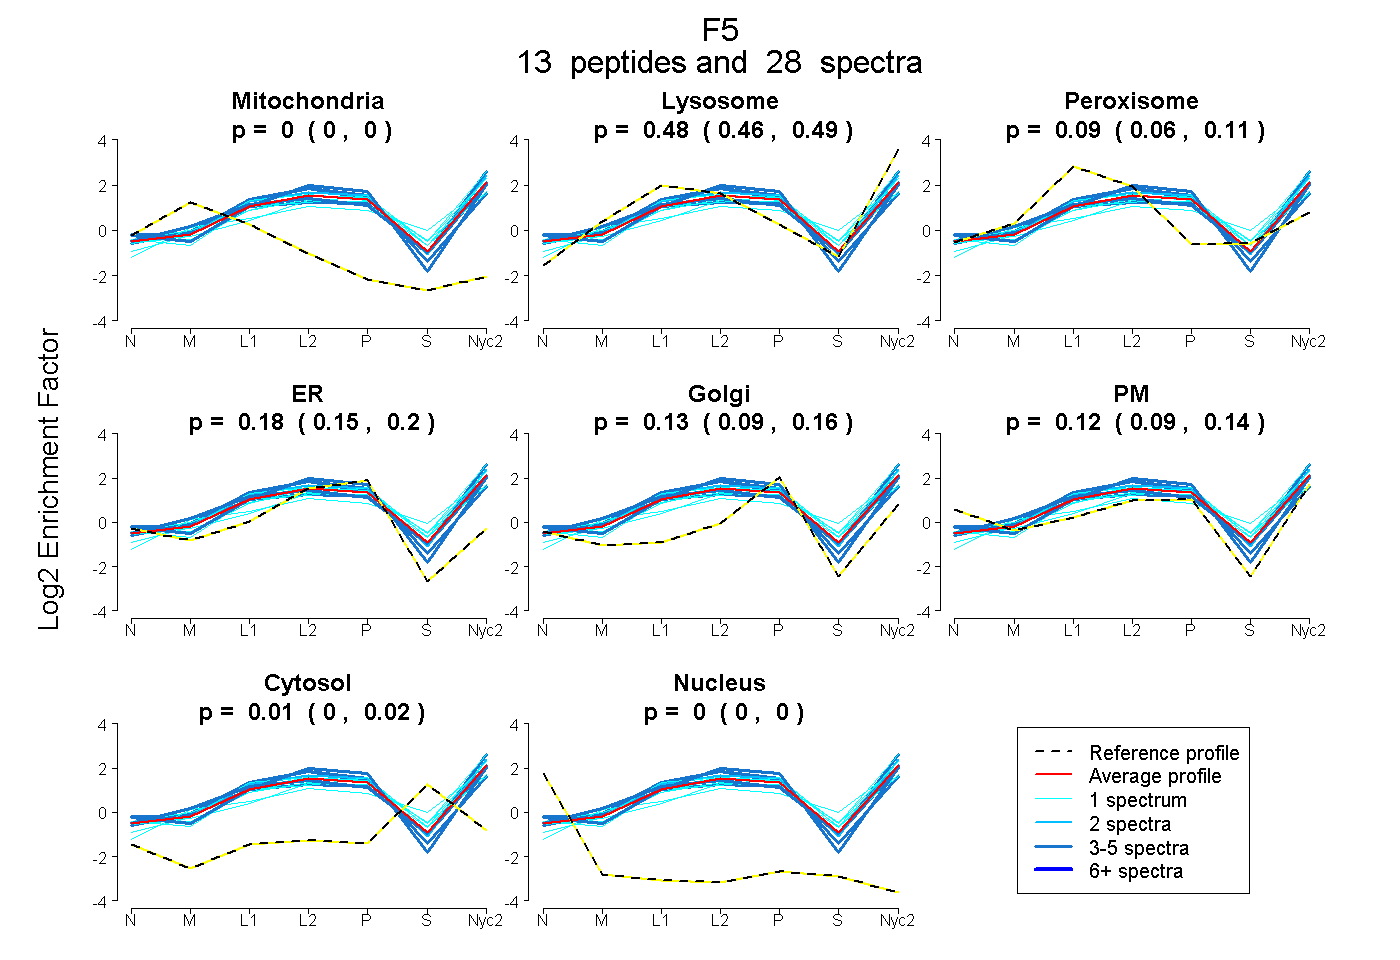
0.000 | 0.000
0.463 | 0.494
0.061 | 0.106
0.149 | 0.202
0.086 | 0.158
0.095 | 0.137
0.003 | 0.021
0.000 | 0.000
3peptides
spectra
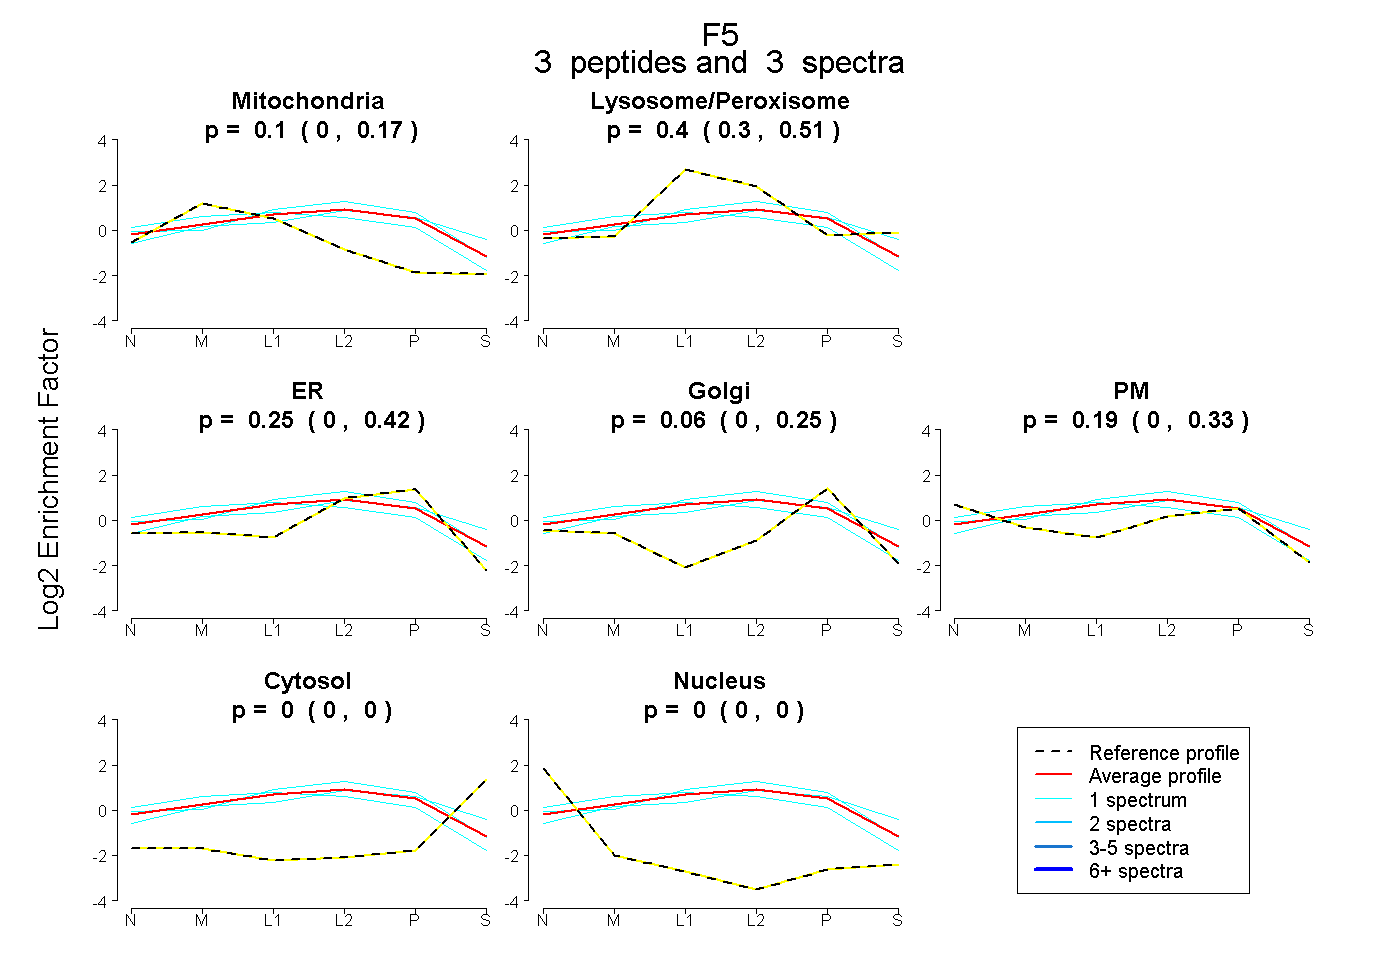
0.003 | 0.174
0.301 | 0.513
0.000 | 0.417
0.000 | 0.252
0.000 | 0.333
0.000 | 0.000
0.000 | 0.000
17peptides
spectra
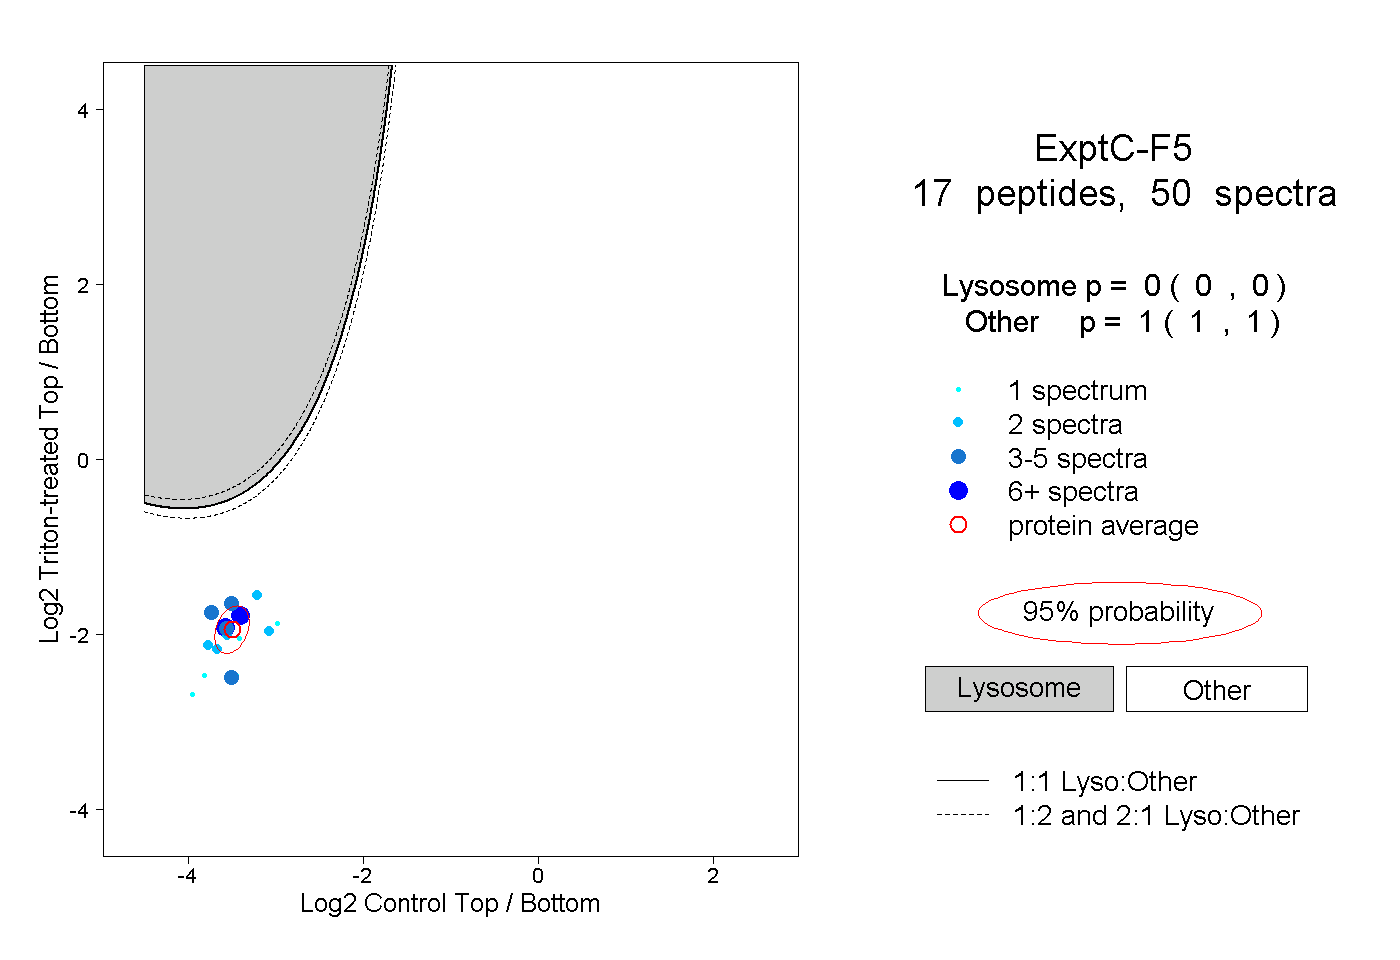
0.000 | 0.000
1.000 | 1.000
3peptides
spectra

0.000 | 0.000
1.000 | 1.000