 5
5peptides
spectra
0.119 | 0.387
0.000 | 0.000
0.000 | 0.134
0.000 | 0.237
0.000 | 0.131
0.000 | 0.057
0.337 | 0.446
0.040 | 0.189
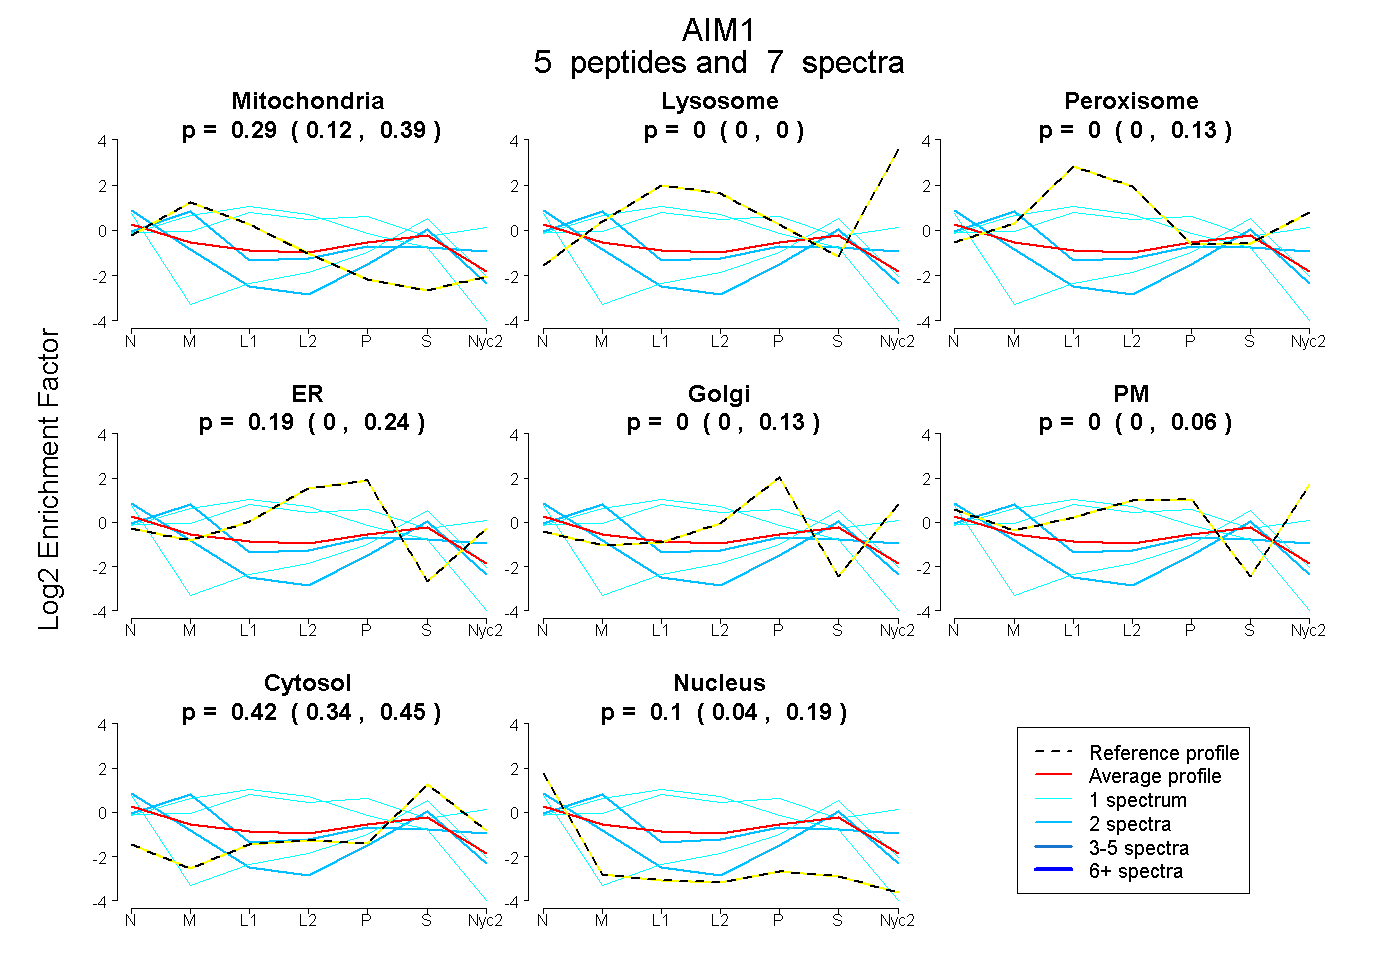
| Plot | Mito | Lyso | Perox | ER | Golgi | PM | Cytosol | Nucleus | |||||
| Expt A |
5 peptides |
7 spectra |
|
0.294 0.119 | 0.387 |
0.000 0.000 | 0.000 |
0.000 0.000 | 0.134 |
0.191 0.000 | 0.237 |
0.000 0.000 | 0.131 |
0.000 0.000 | 0.057 |
0.416 0.337 | 0.446 |
0.100 0.040 | 0.189 |
| 1 spectrum, TPVTKPGGR | 0.000 | 0.000 | 0.000 | 0.000 | 0.000 | 0.000 | 0.637 | 0.363 | ||
| 1 spectrum, NSDATASVLVNGGVNMSDLK | 0.576 | 0.000 | 0.115 | 0.234 | 0.000 | 0.000 | 0.076 | 0.000 | ||
| 2 spectra, LNPRPGK | 0.149 | 0.000 | 0.000 | 0.000 | 0.000 | 0.000 | 0.435 | 0.415 | ||
| 1 spectrum, ESPPK | 0.032 | 0.000 | 0.477 | 0.000 | 0.322 | 0.000 | 0.170 | 0.000 | ||
| 2 spectra, HVVQDYR | 0.502 | 0.000 | 0.000 | 0.000 | 0.217 | 0.000 | 0.281 | 0.000 |
| Plot | Lyso | Other | |||||||||||
| Expt C |
1 peptide |
1 spectrum |
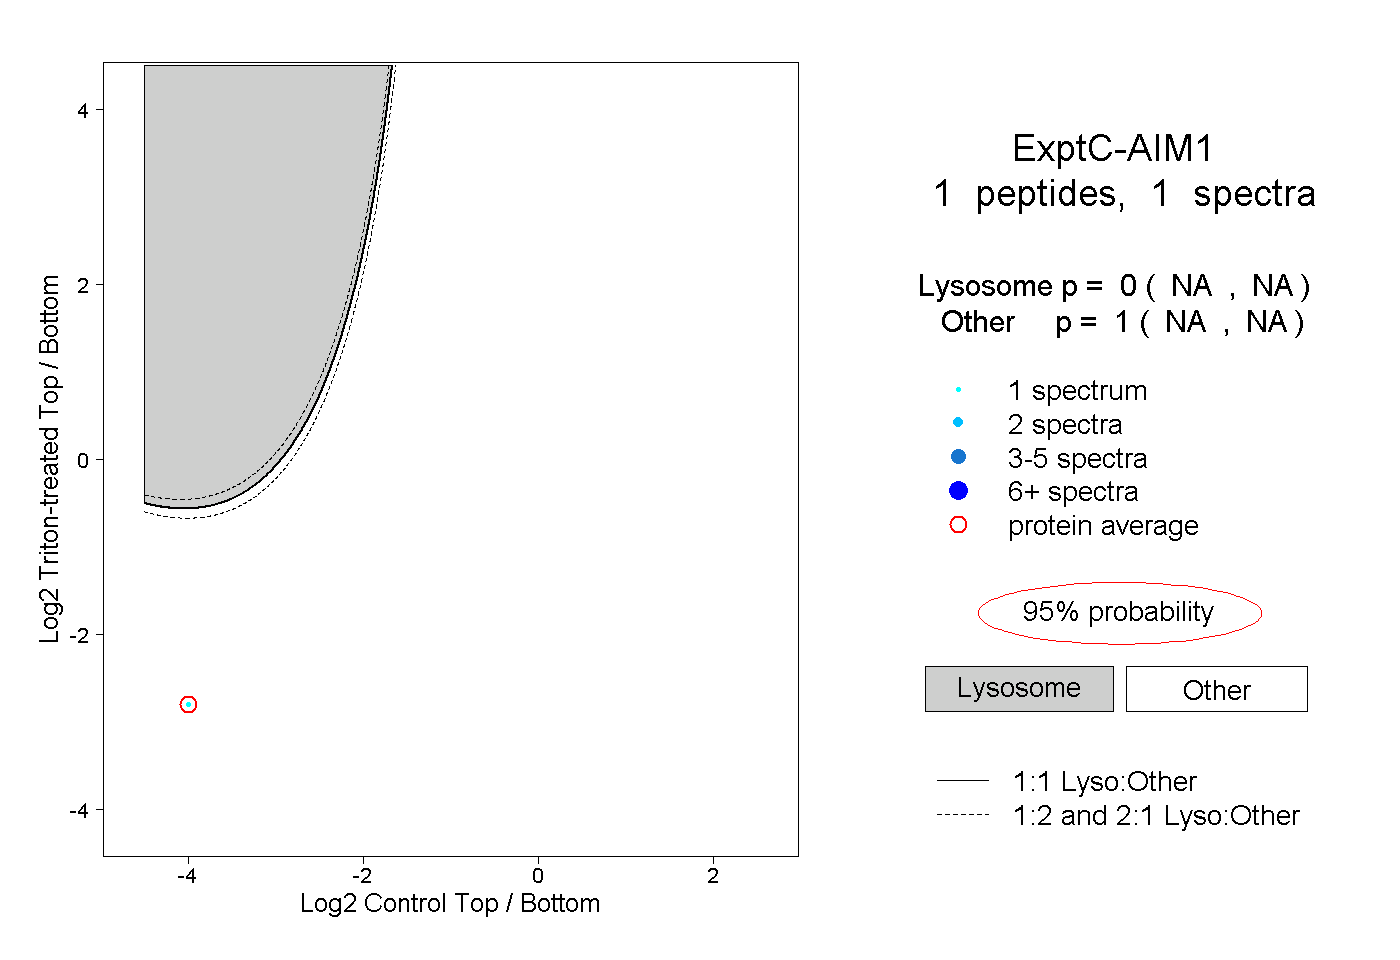 |
0.000 NA | NA |
1.000 NA | NA |