 19
19peptides
spectra
0.000 | 0.000
0.000 | 0.000
0.000 | 0.000
0.173 | 0.263
0.016 | 0.089
0.000 | 0.040
0.098 | 0.126
0.581 | 0.602
2peptides
spectra

NA | NA
NA | NA
NA | NA
NA | NA
NA | NA
NA | NA
NA | NA
| Plot | Mito | Lyso | Perox | ER | Golgi | PM | Cytosol | Nucleus | |||||
| Expt A |
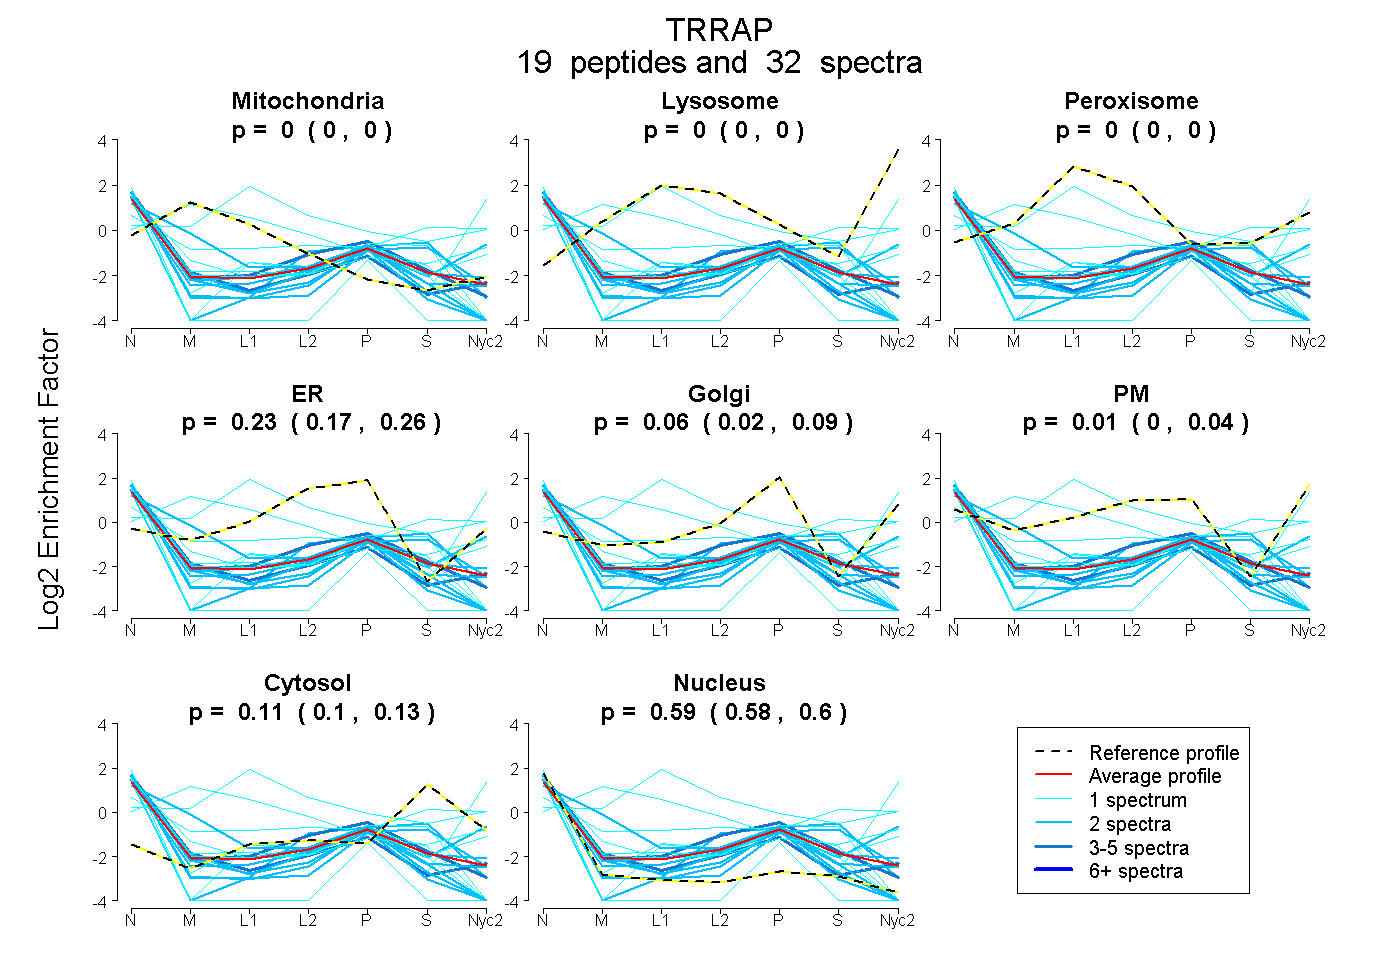
19 peptides |
32 spectra |
|
0.000 0.000 | 0.000 |
0.000 0.000 | 0.000 |
0.000 0.000 | 0.000 |
0.226 0.173 | 0.263 |
0.059 0.016 | 0.089 |
0.009 0.000 | 0.040 |
0.113 0.098 | 0.126 |
0.592 0.581 | 0.602 |
||
| Plot | Mito | Lyso or Perox | ER | Golgi | PM | Cytosol | Nucleus | ||||||
| Expt B |
2 peptides |
2 spectra |
|
0.165 NA | NA |
0.315 NA | NA |
0.000 NA | NA |
0.000 NA | NA |
0.000 NA | NA |
0.202 NA | NA |
0.318 NA | NA |