 2
2peptides
spectra
0.000 | 0.000
0.000 | 0.000
0.000 | 0.048
0.000 | 0.080
0.000 | 0.104
0.603 | 0.756
0.202 | 0.270
0.000 | 0.000
3peptides
spectra
0.000 | 0.001
0.999 | 1.000
| Plot | Mito | Lyso | Perox | ER | Golgi | PM | Cytosol | Nucleus | |||||
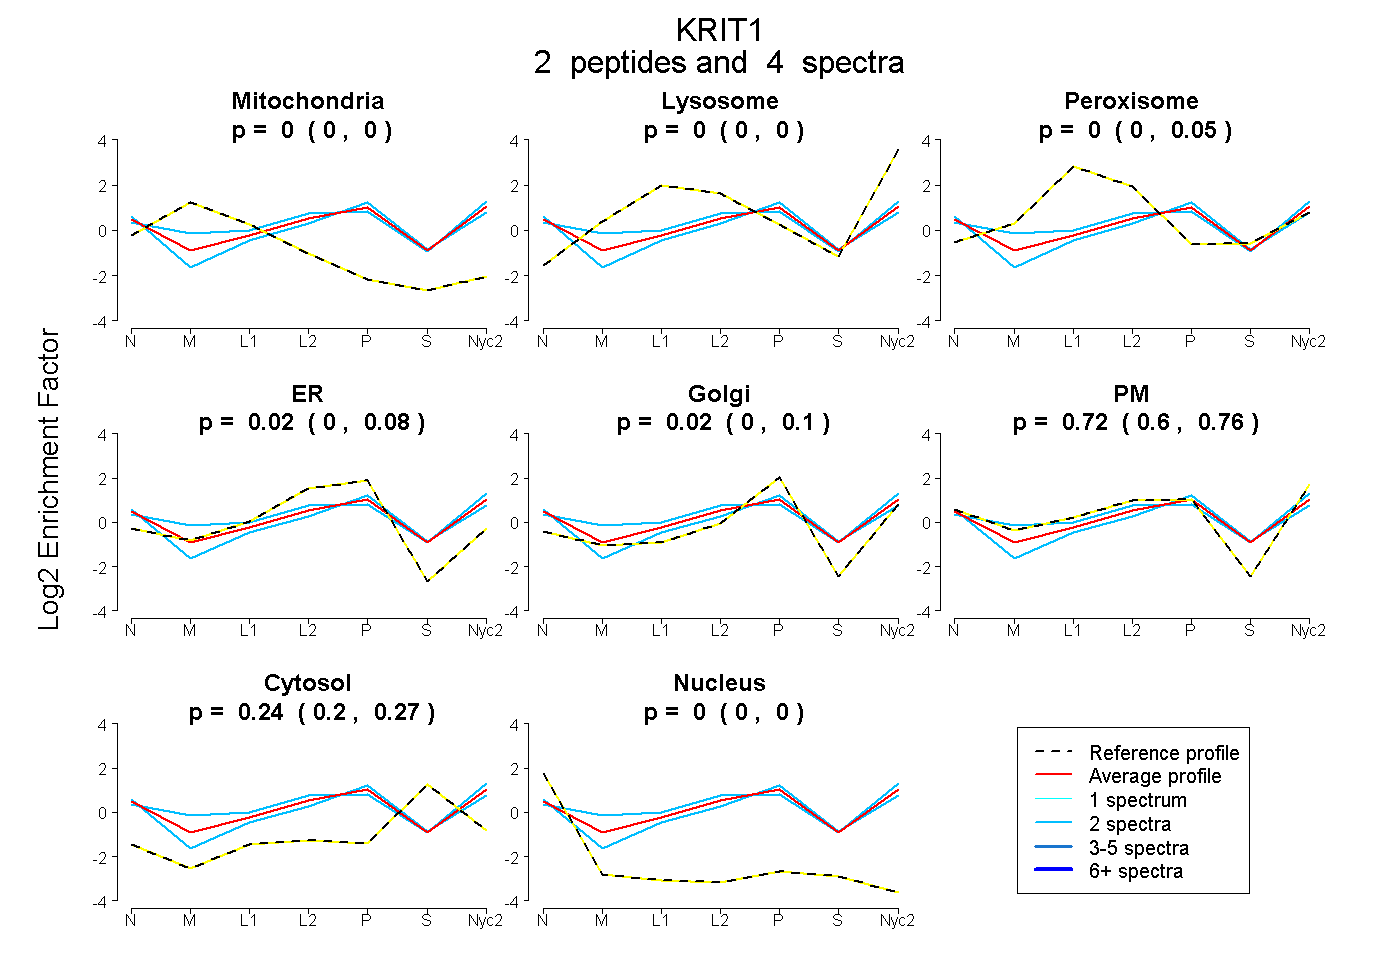
| Expt A |
2 peptides |
4 spectra |
|
0.000 0.000 | 0.000 |
0.000 0.000 | 0.000 |
0.000 0.000 | 0.048 |
0.016 0.000 | 0.080 |
0.022 0.000 | 0.104 |
0.718 0.603 | 0.756 |
0.244 0.202 | 0.270 |
0.000 0.000 | 0.000 |
||
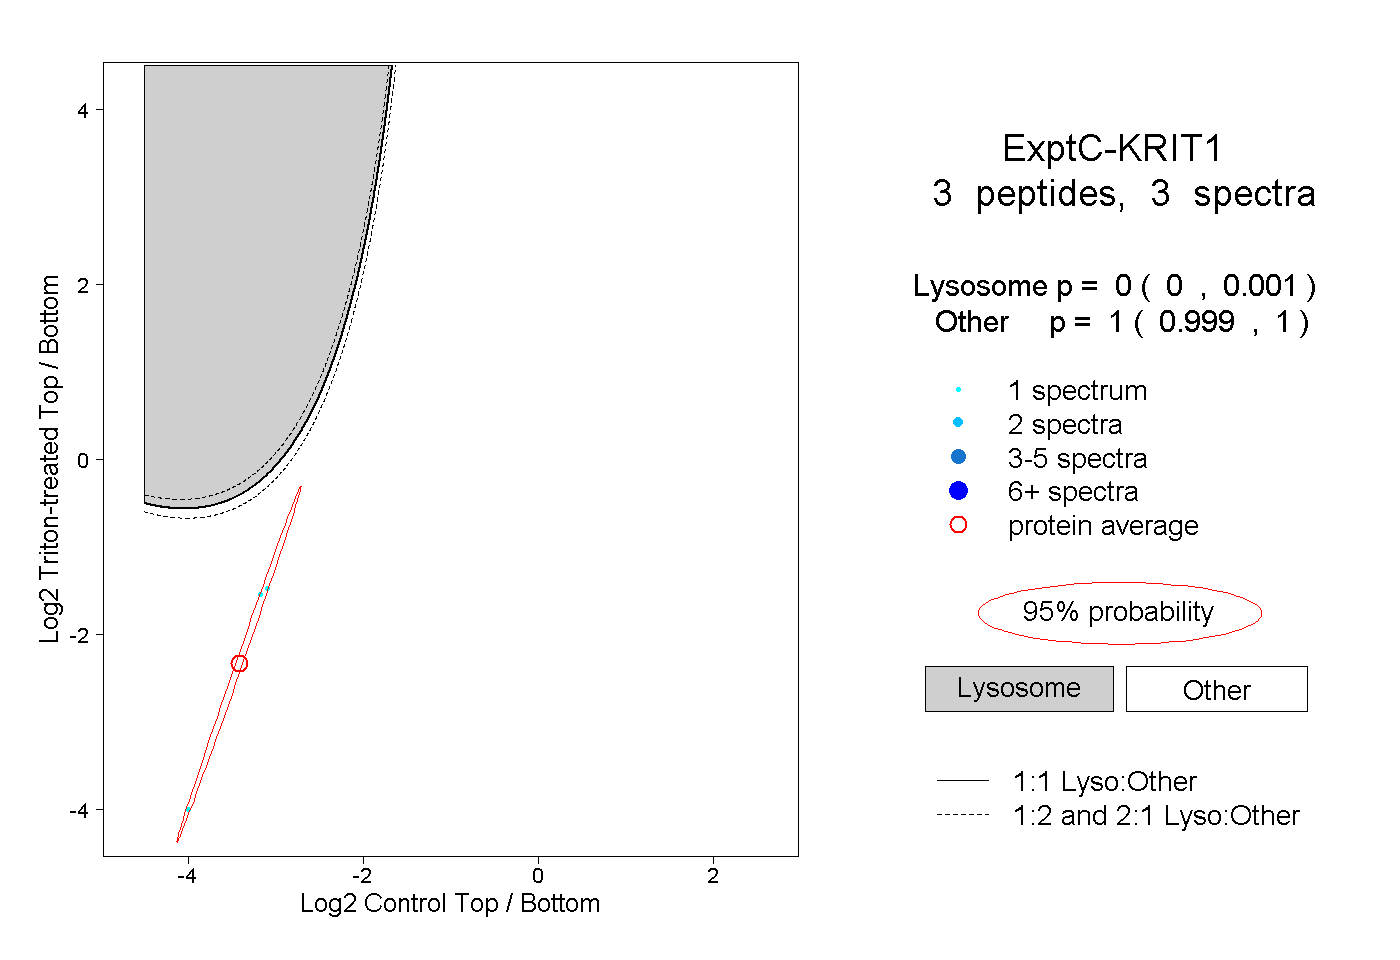
| Plot | Lyso | Other | |||||||||||
| Expt C |
3 peptides |
3 spectra |
|
0.000 0.000 | 0.001 |
1.000 0.999 | 1.000 |