 5
5peptides
spectra
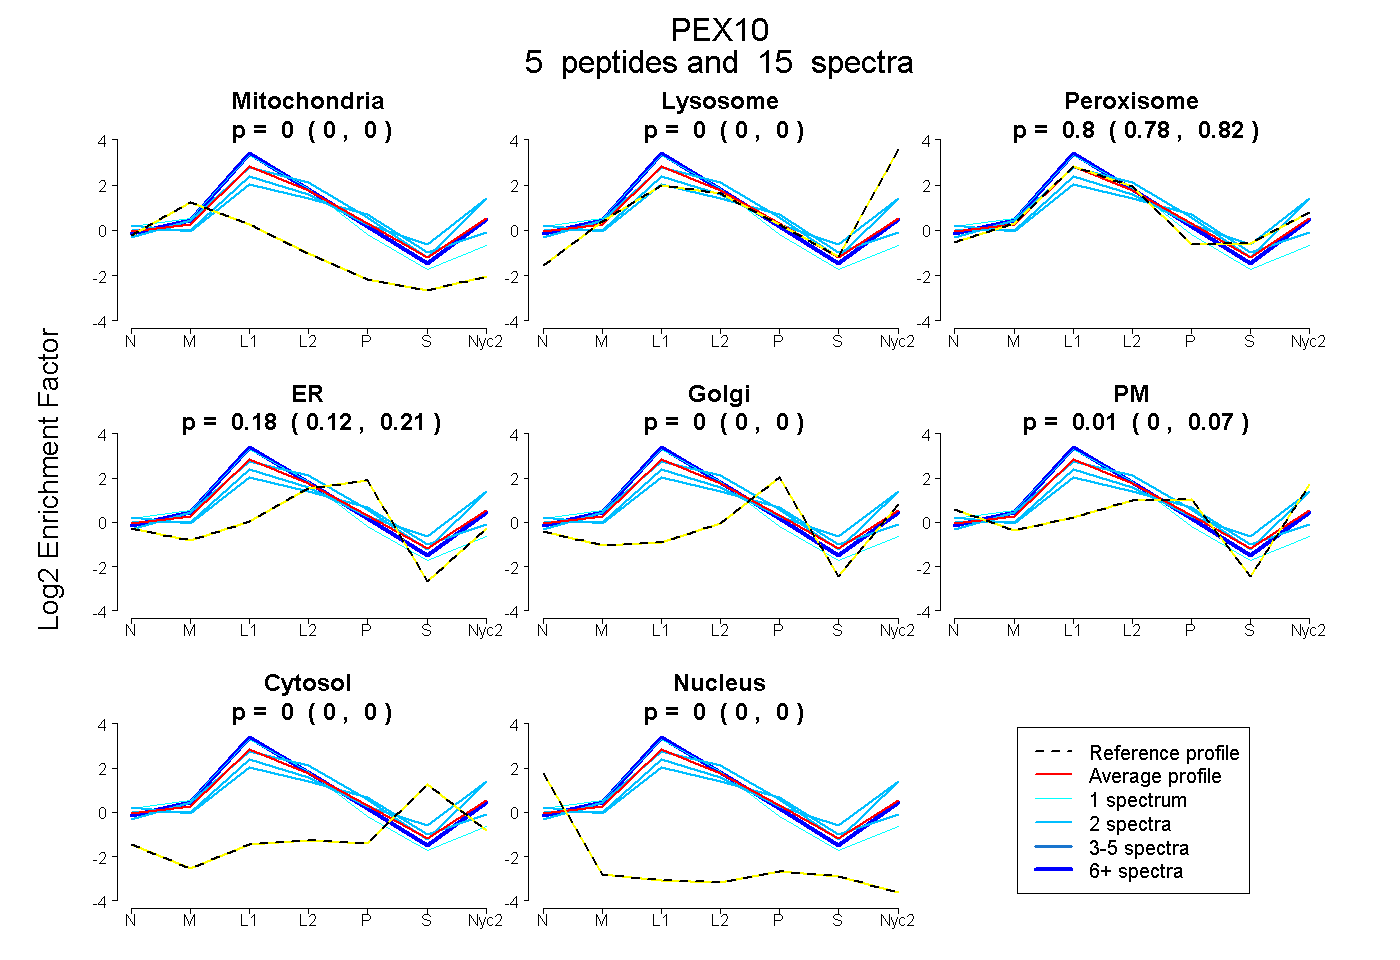
0.000 | 0.000
0.000 | 0.000
0.776 | 0.823
0.120 | 0.211
0.000 | 0.000
0.000 | 0.073
0.000 | 0.000
0.000 | 0.000
6peptides
spectra
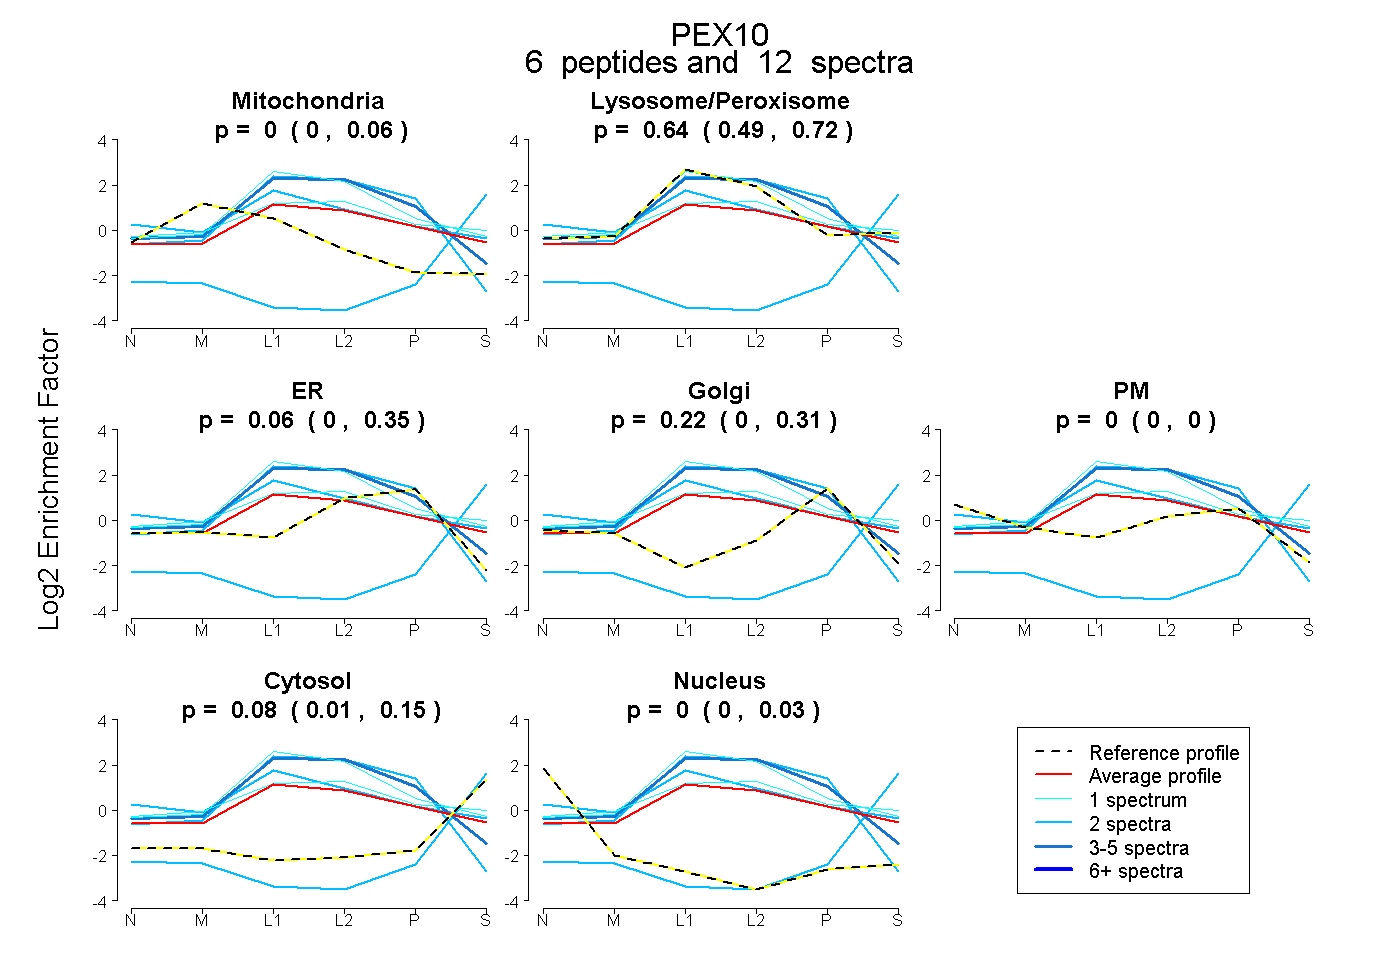
0.000 | 0.057
0.493 | 0.716
0.000 | 0.346
0.000 | 0.308
0.000 | 0.000
0.007 | 0.154
0.000 | 0.032
10peptides
spectra
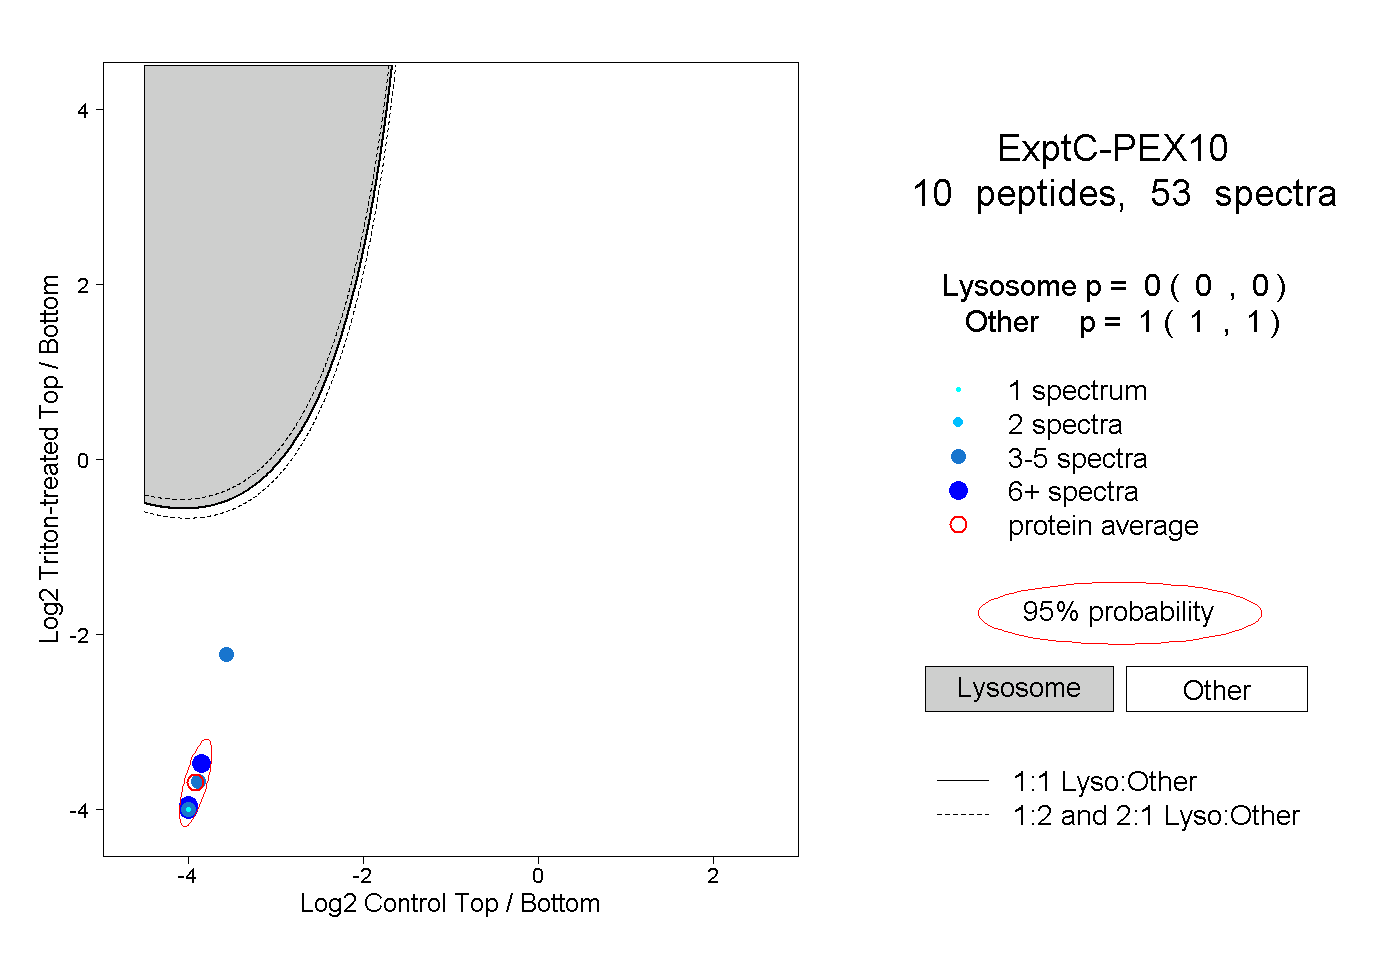
0.000 | 0.000
1.000 | 1.000
3peptides
spectra
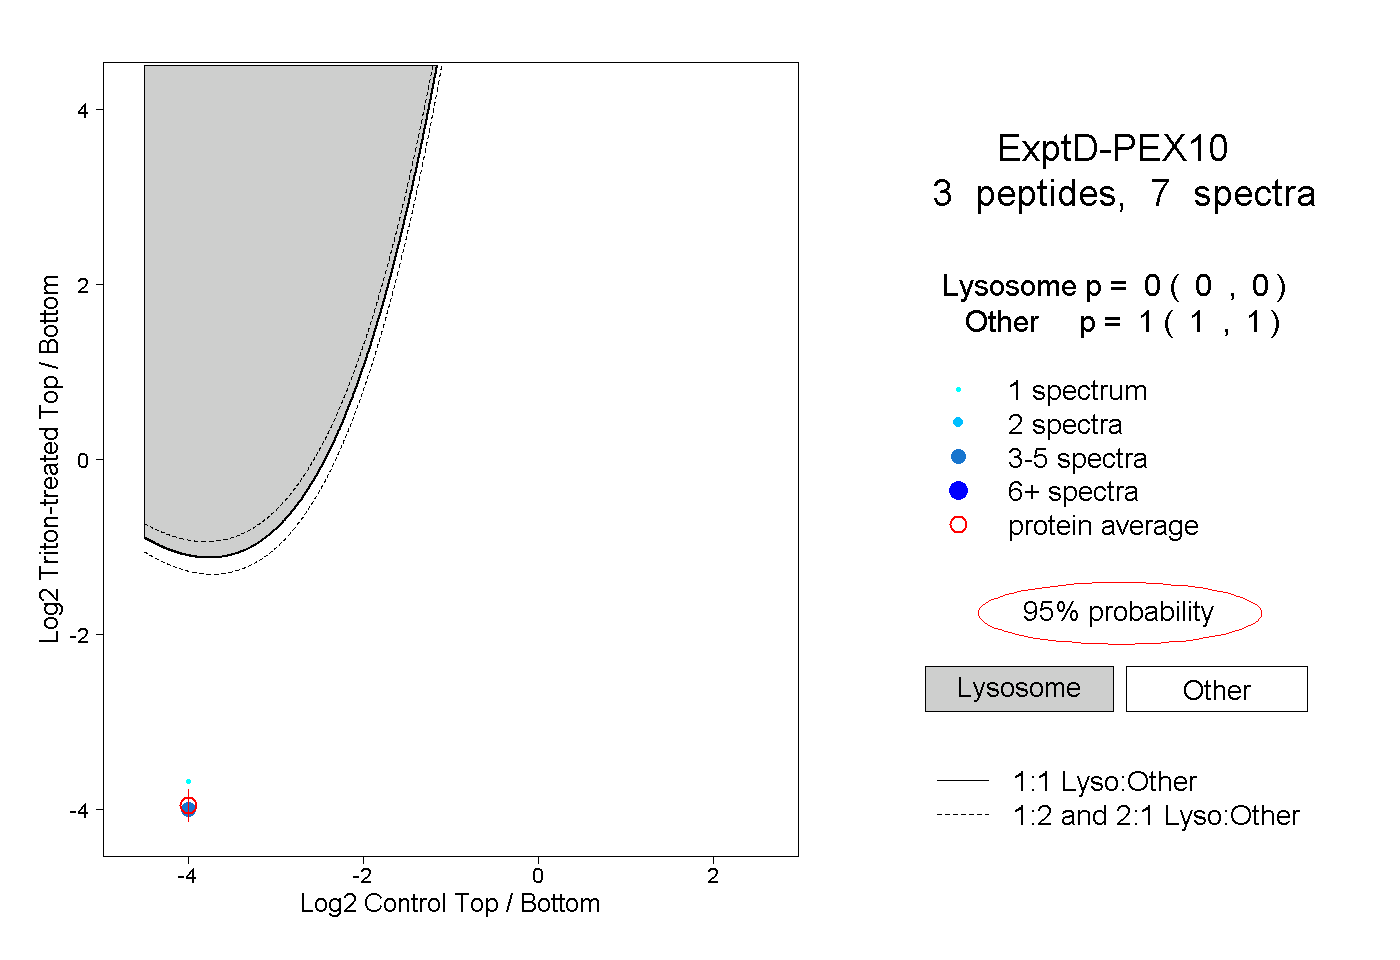
0.000 | 0.000
1.000 | 1.000