8
8peptides
spectra
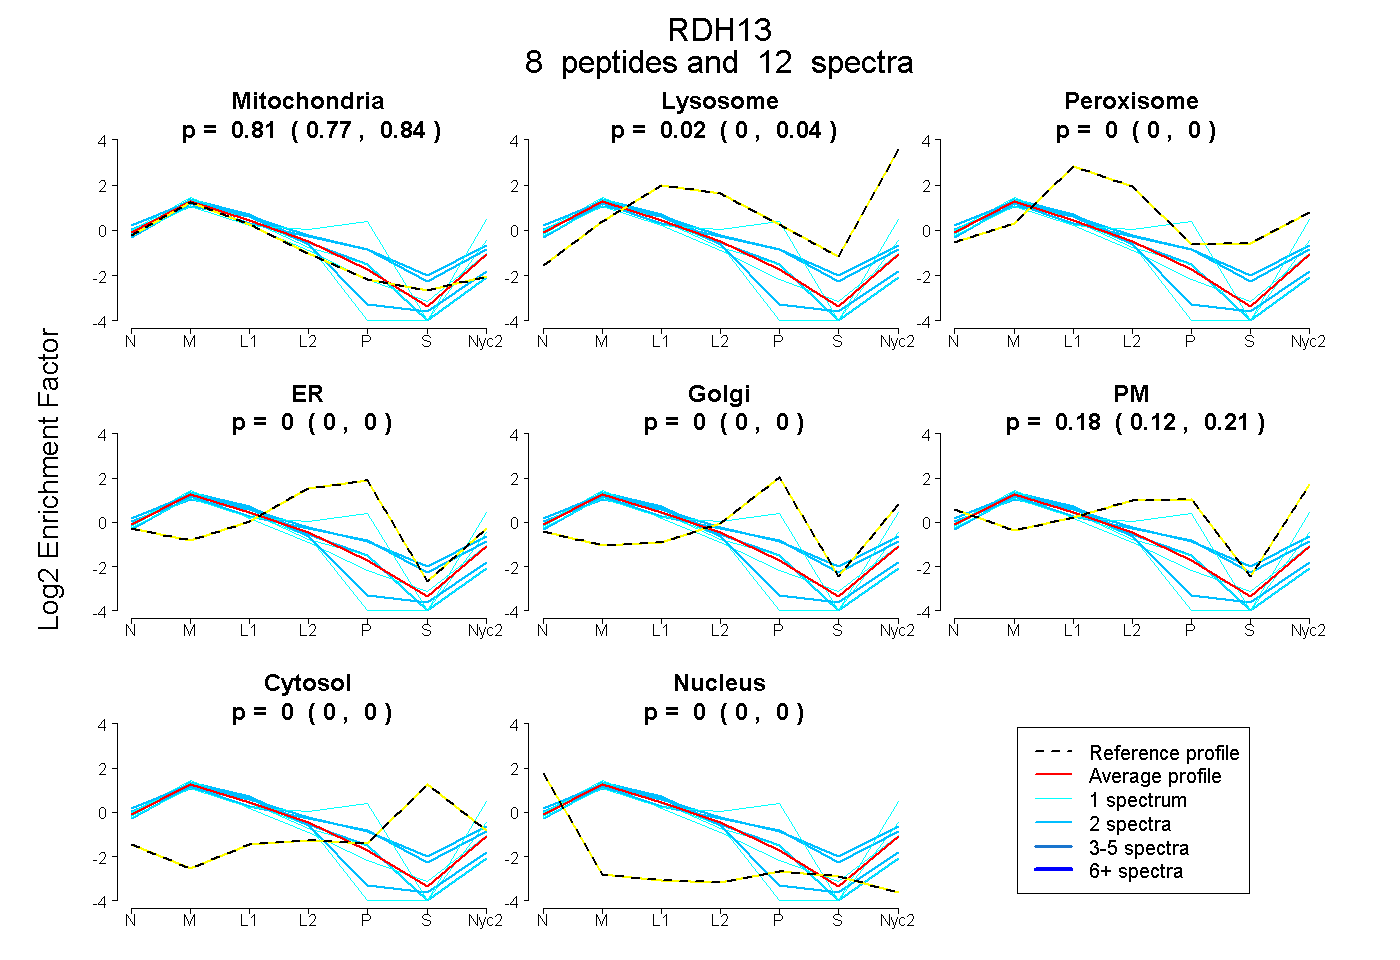
0.773 | 0.839
0.000 | 0.044
0.000 | 0.000
0.000 | 0.000
0.000 | 0.000
0.120 | 0.214
0.000 | 0.000
0.000 | 0.000
3peptides
spectra
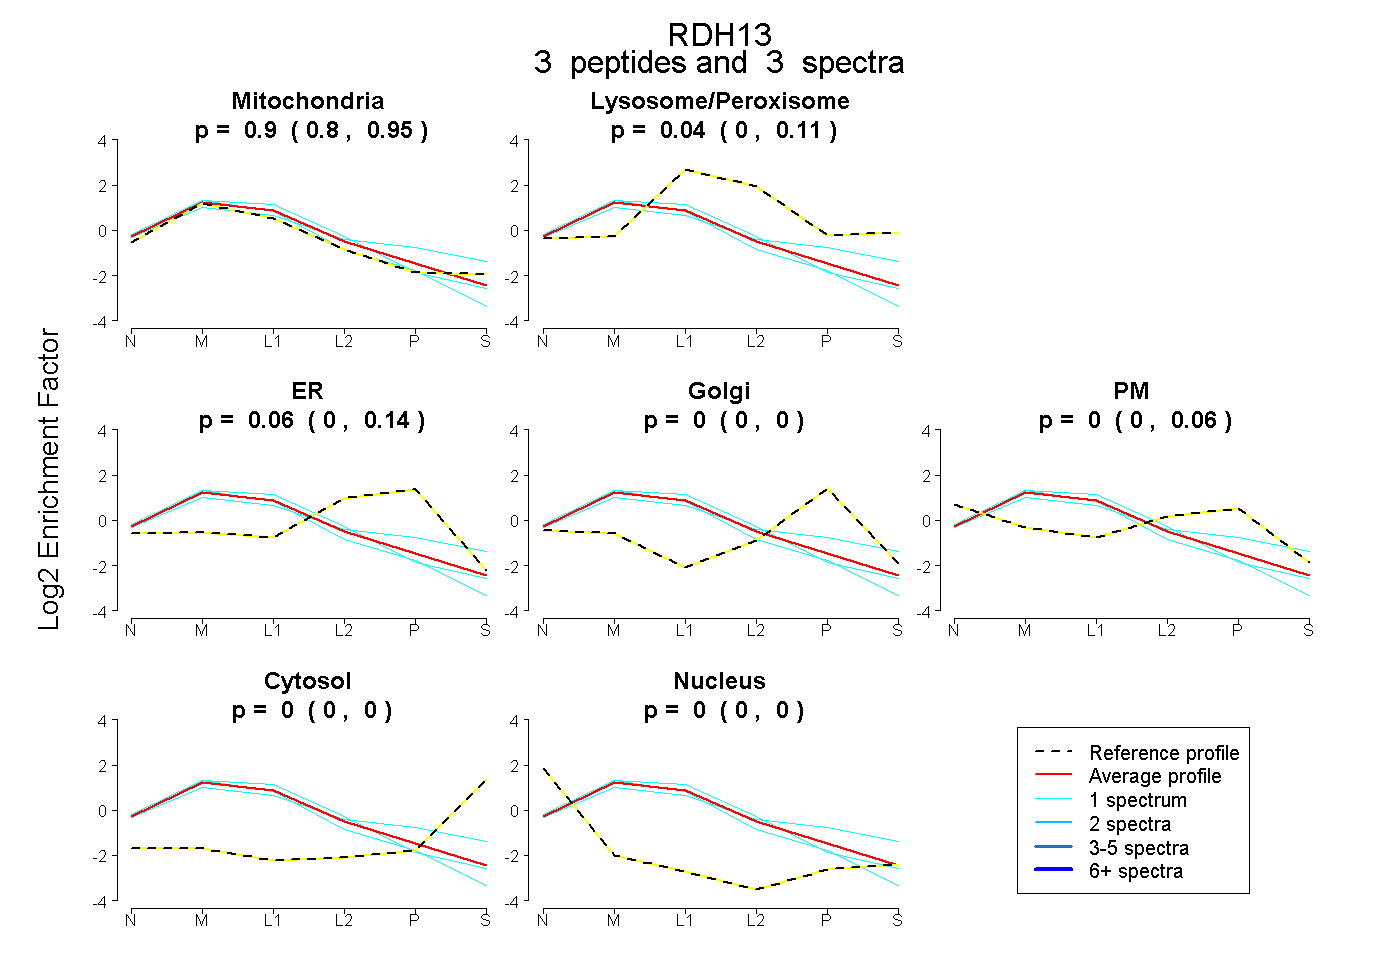
0.799 | 0.954
0.000 | 0.108
0.000 | 0.136
0.000 | 0.000
0.000 | 0.064
0.000 | 0.000
0.000 | 0.000
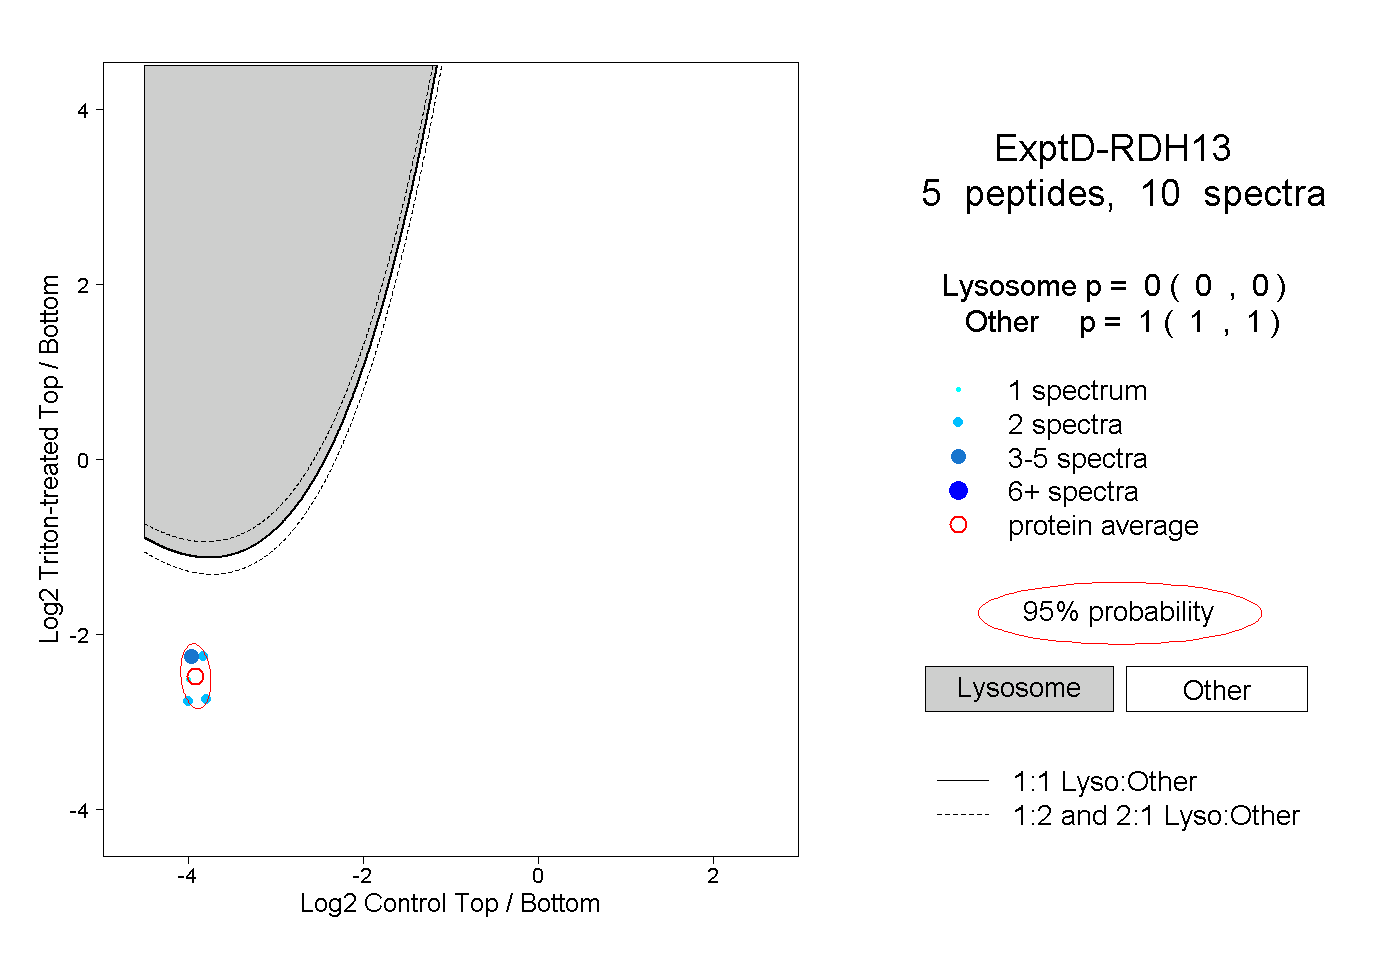
12peptides
spectra
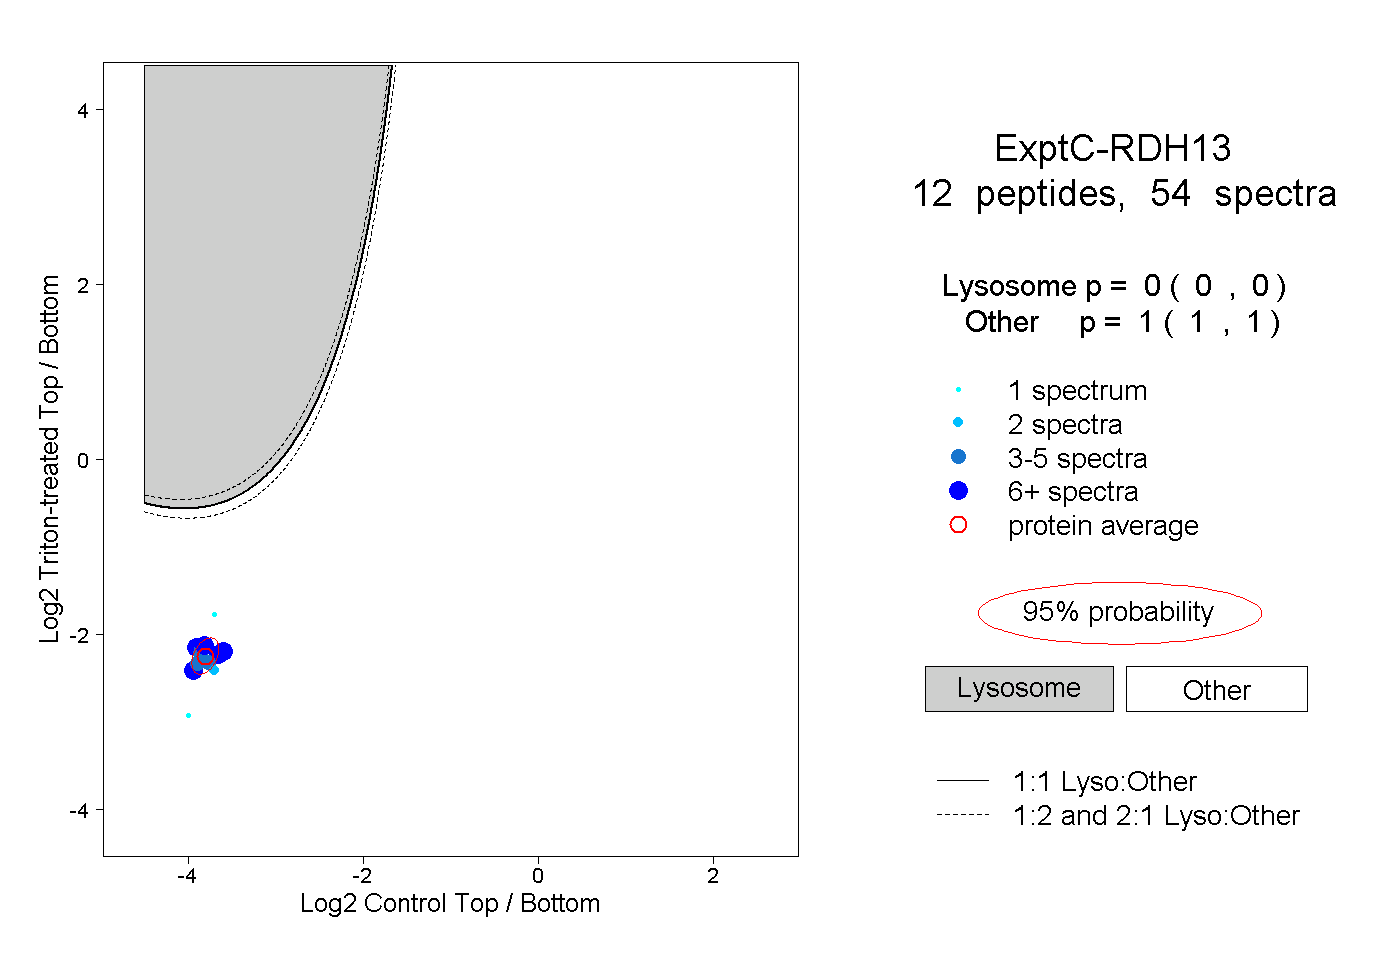
0.000 | 0.000
1.000 | 1.000