 8
8peptides
spectra
0.773 | 0.839
0.000 | 0.044
0.000 | 0.000
0.000 | 0.000
0.000 | 0.000
0.120 | 0.214
0.000 | 0.000
0.000 | 0.000
| Plot | Mito | Lyso | Perox | ER | Golgi | PM | Cytosol | Nucleus | |||||
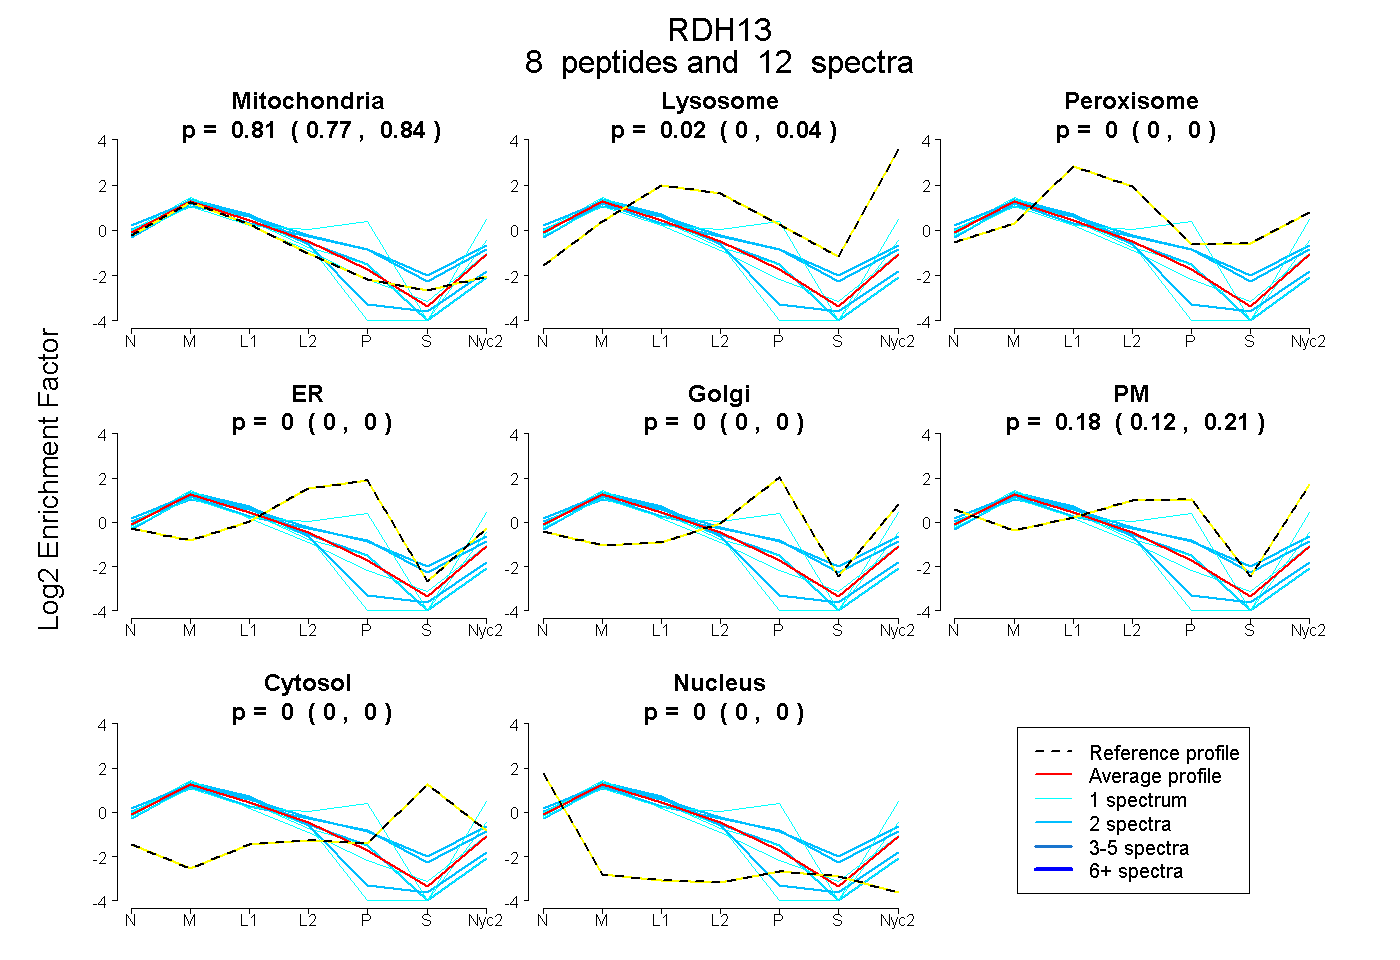
| Expt A |
8 peptides |
12 spectra |
|
0.808 0.773 | 0.839 |
0.017 0.000 | 0.044 |
0.000 0.000 | 0.000 |
0.000 0.000 | 0.000 |
0.000 0.000 | 0.000 |
0.175 0.120 | 0.214 |
0.000 0.000 | 0.000 |
0.000 0.000 | 0.000 |
| 2 spectra, TVIVTGANTGIGK | 1.000 | 0.000 | 0.000 | 0.000 | 0.000 | 0.000 | 0.000 | 0.000 | ||
| 1 spectrum, QTALELAK | 0.888 | 0.054 | 0.000 | 0.000 | 0.000 | 0.058 | 0.000 | 0.000 | ||
| 1 spectrum, LAVVLFTK | 0.896 | 0.000 | 0.000 | 0.104 | 0.000 | 0.000 | 0.000 | 0.000 | ||
| 1 spectrum, YFDGLR | 0.366 | 0.000 | 0.000 | 0.033 | 0.071 | 0.530 | 0.000 | 0.000 | ||
| 2 spectra, GGNIILACR | 0.878 | 0.000 | 0.000 | 0.122 | 0.000 | 0.000 | 0.000 | 0.000 | ||
| 2 spectra, VDILVNNAAVMR | 0.668 | 0.124 | 0.000 | 0.107 | 0.050 | 0.052 | 0.000 | 0.000 | ||
| 2 spectra, AEHLDLASLK | 0.593 | 0.010 | 0.149 | 0.000 | 0.028 | 0.221 | 0.000 | 0.000 | ||
| 1 spectrum, LQGTGVTVNALHPGVAR | 0.938 | 0.062 | 0.000 | 0.000 | 0.000 | 0.000 | 0.000 | 0.000 |
| Plot | Mito | Lyso or Perox | ER | Golgi | PM | Cytosol | Nucleus | ||||||
| Expt B |
3 peptides |
3 spectra |
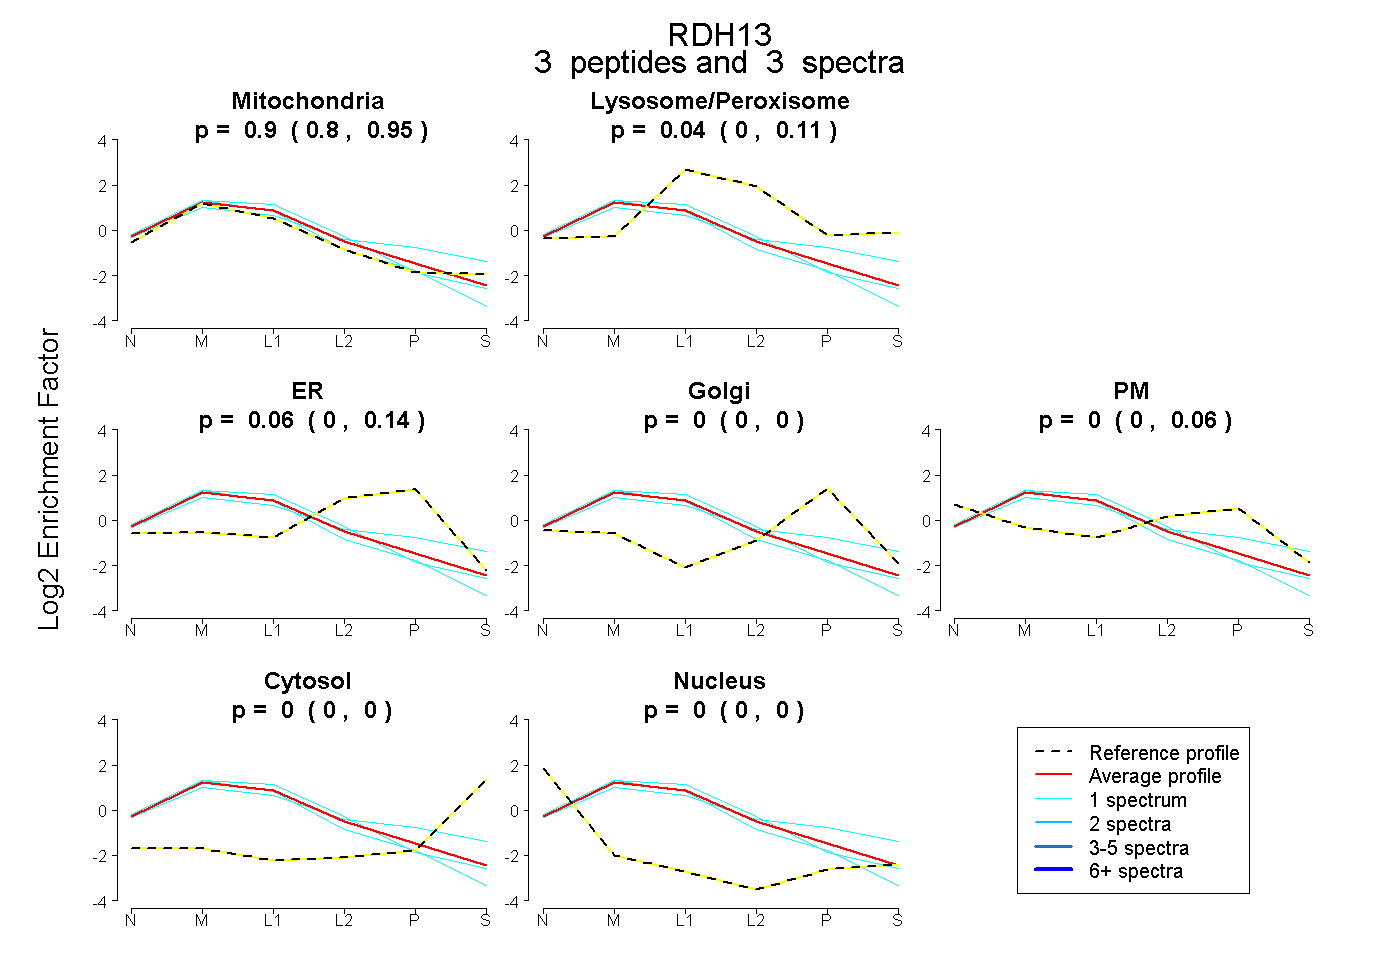 |
0.898 0.799 | 0.954 |
0.039 0.000 | 0.108 |
0.064 0.000 | 0.136 |
0.000 0.000 | 0.000 |
0.000 0.000 | 0.064 |
0.000 0.000 | 0.000 |
0.000 0.000 | 0.000 |
|||
| Plot | Lyso | Other | |||||||||||
| Expt C |
12 peptides |
54 spectra |
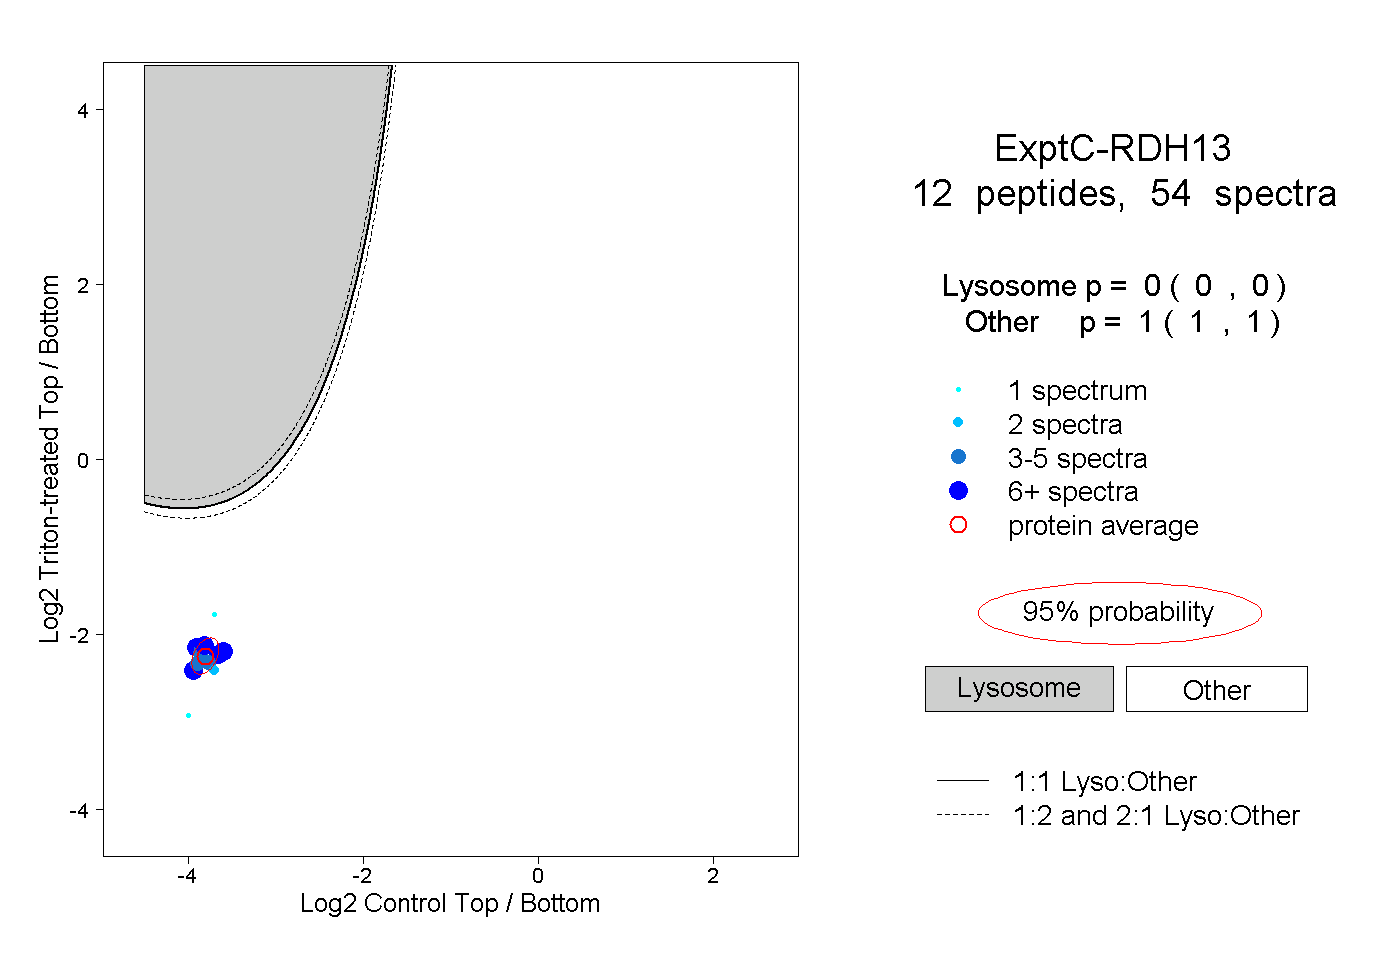 |
0.000 0.000 | 0.000 |
1.000 1.000 | 1.000 |
||||||||
| Plot | Lyso | Other | |||||||||||
| Expt D |
5 peptides |
10 spectra |
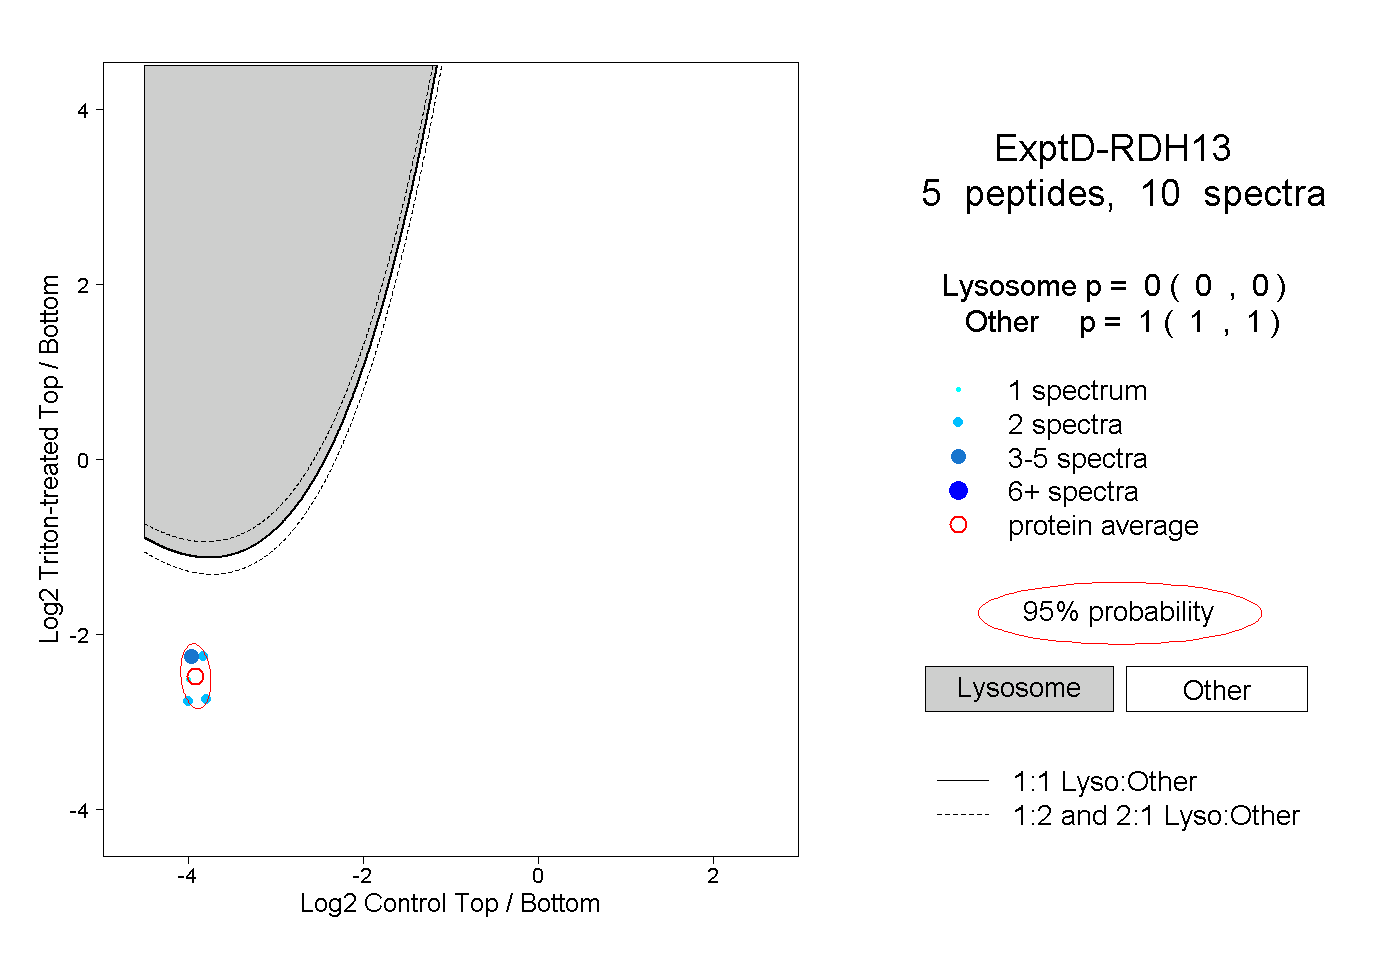 |
0.000 0.000 | 0.000 |
1.000 1.000 | 1.000 |