 23
23peptides
spectra
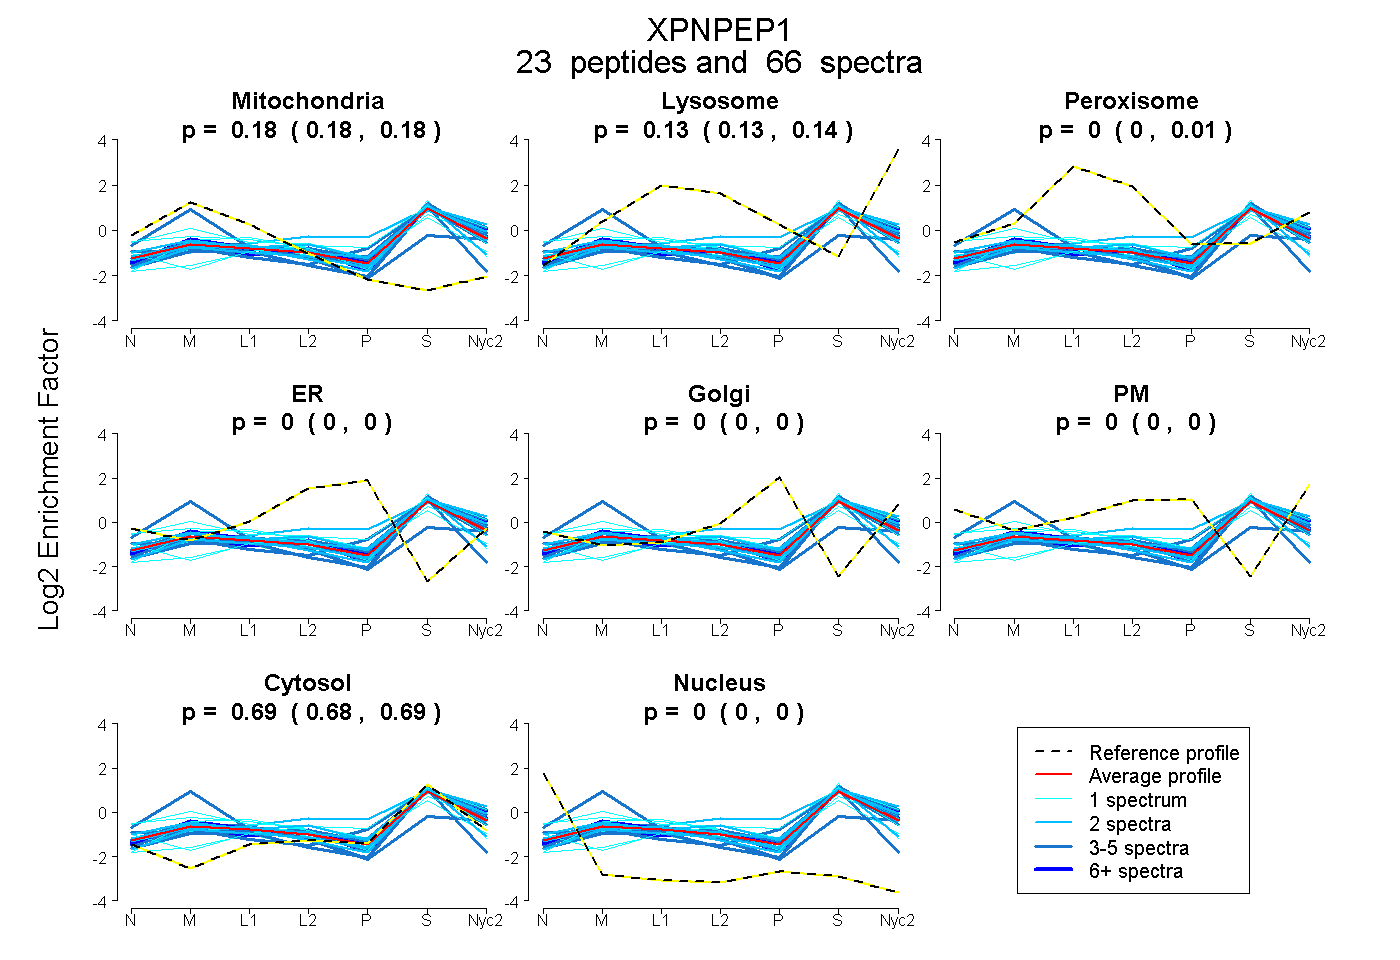
0.175 | 0.183
0.126 | 0.136
0.000 | 0.007
0.000 | 0.000
0.000 | 0.000
0.000 | 0.000
0.683 | 0.689
0.000 | 0.000
6peptides
spectra
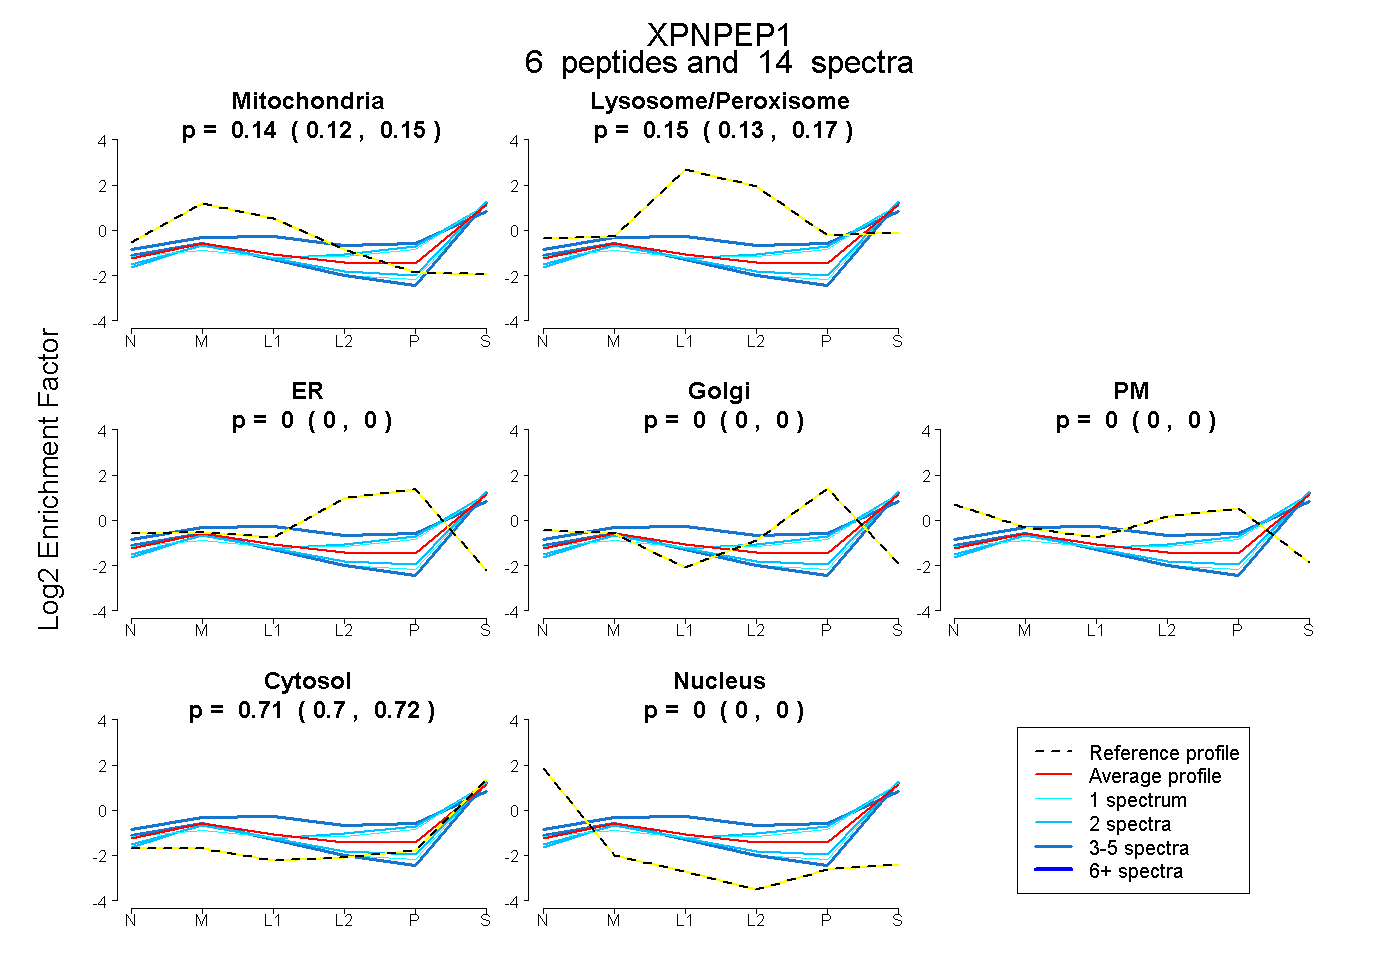
0.116 | 0.154
0.126 | 0.172
0.000 | 0.000
0.000 | 0.000
0.000 | 0.000
0.699 | 0.723
0.000 | 0.000
18peptides
spectra
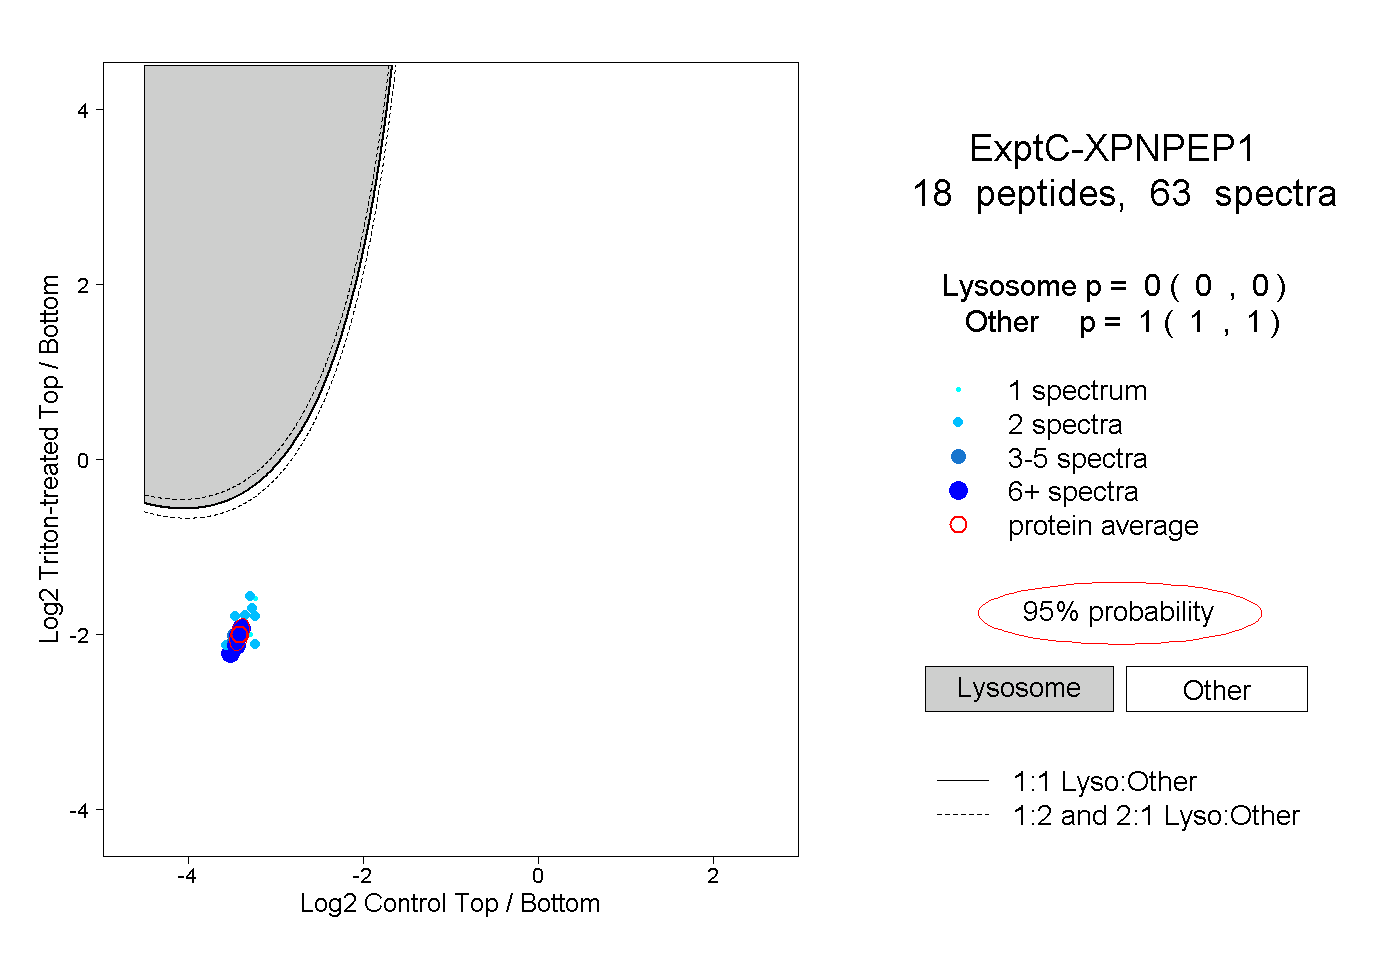
0.000 | 0.000
1.000 | 1.000
5peptides
spectra
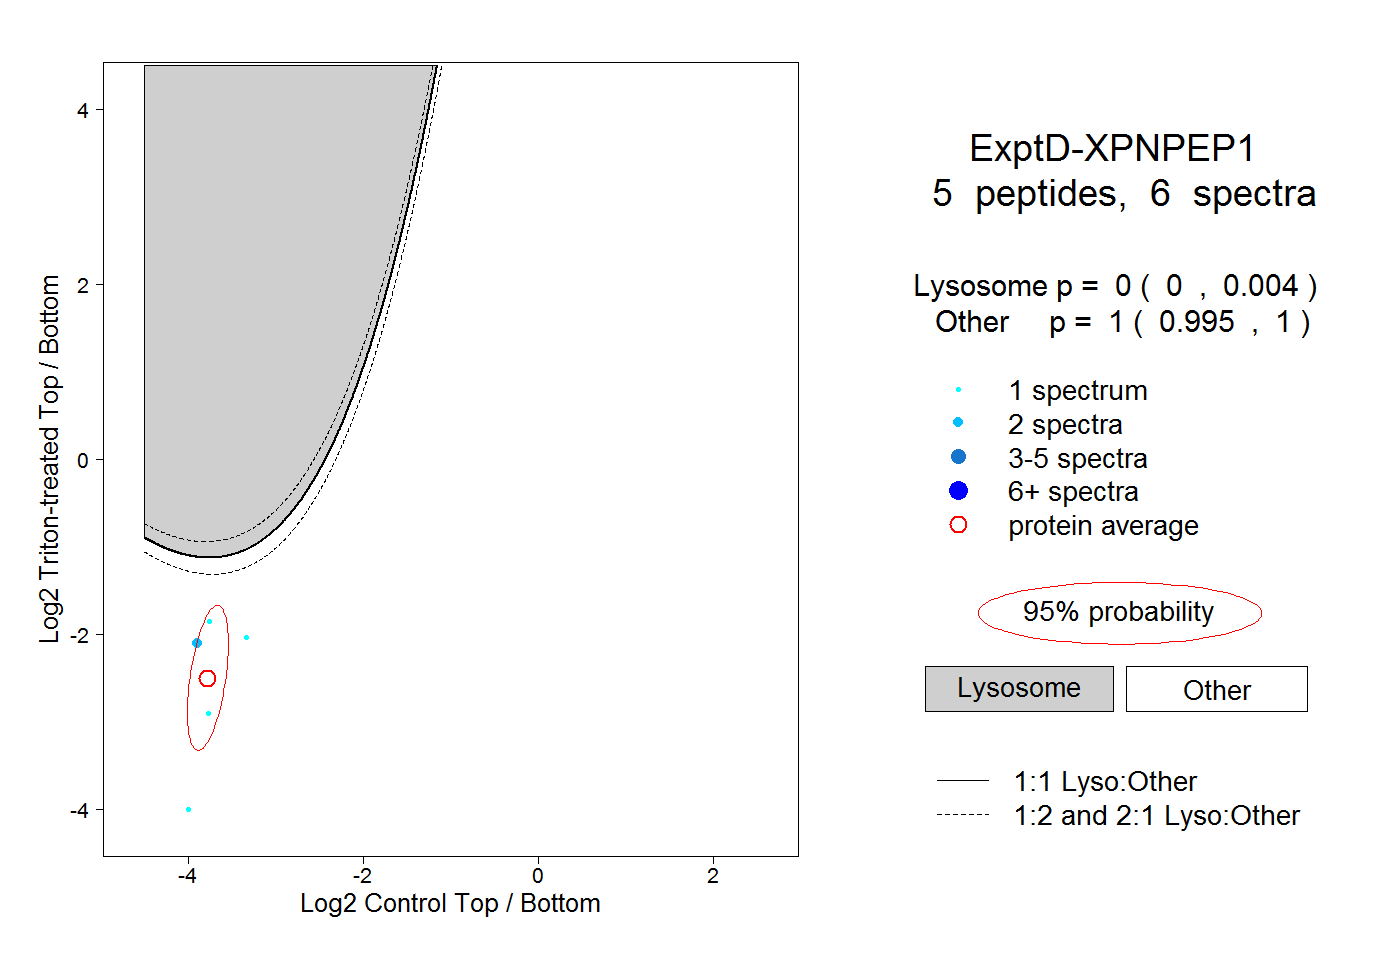
0.000 | 0.004
0.995 | 1.000