 3
3peptides
spectra
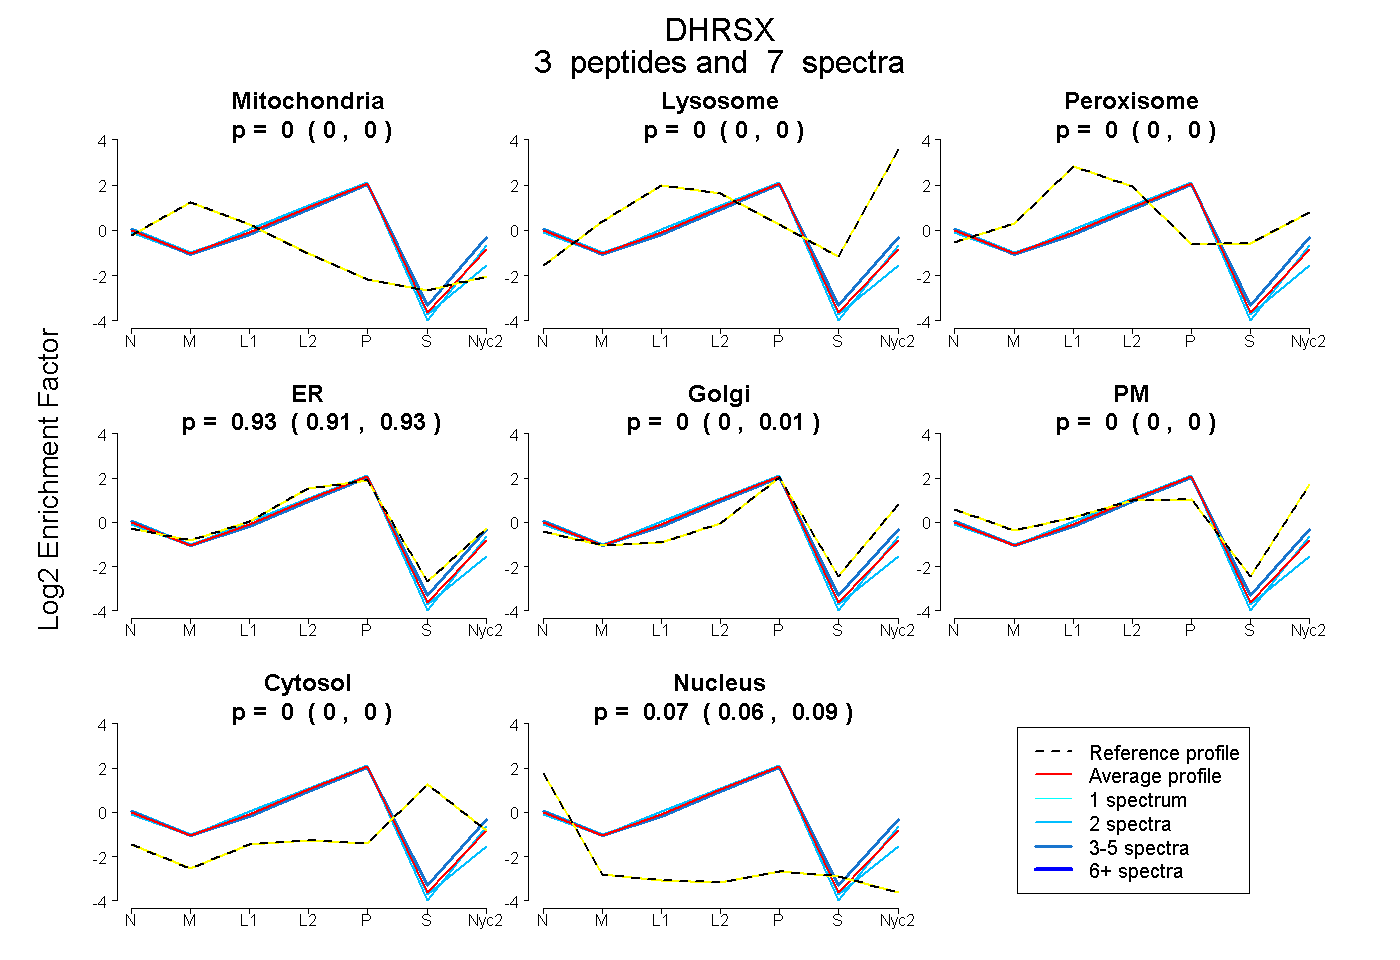
0.000 | 0.000
0.000 | 0.000
0.000 | 0.000
0.910 | 0.934
0.000 | 0.008
0.000 | 0.000
0.000 | 0.000
0.059 | 0.086
3peptides
spectra
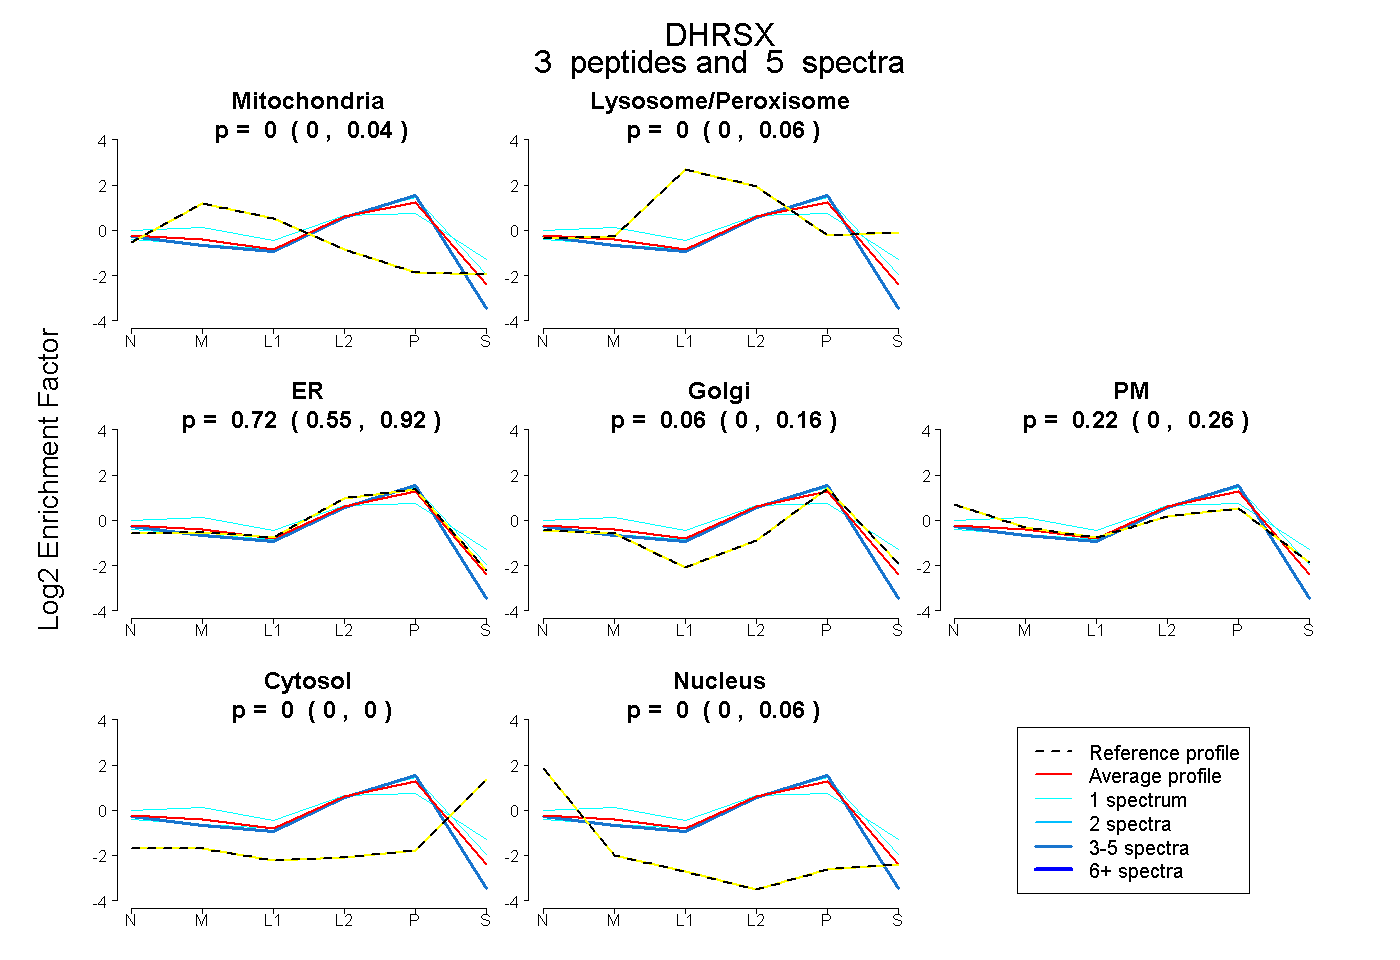
0.000 | 0.040
0.000 | 0.055
0.550 | 0.918
0.000 | 0.155
0.000 | 0.258
0.000 | 0.000
0.000 | 0.061
3peptides
spectra
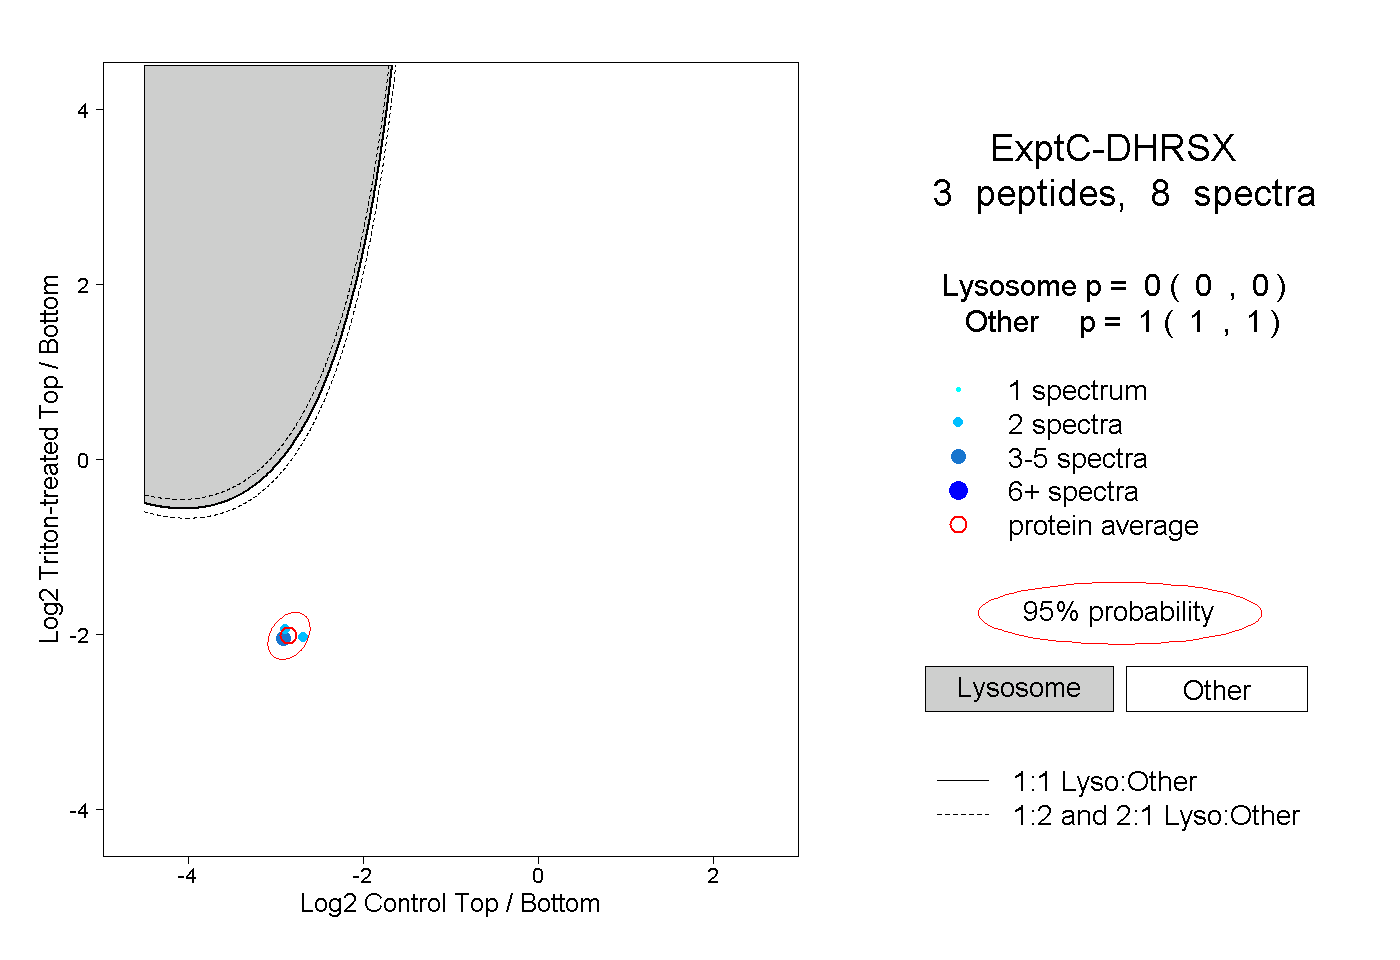
0.000 | 0.000
1.000 | 1.000
2peptides
spectra
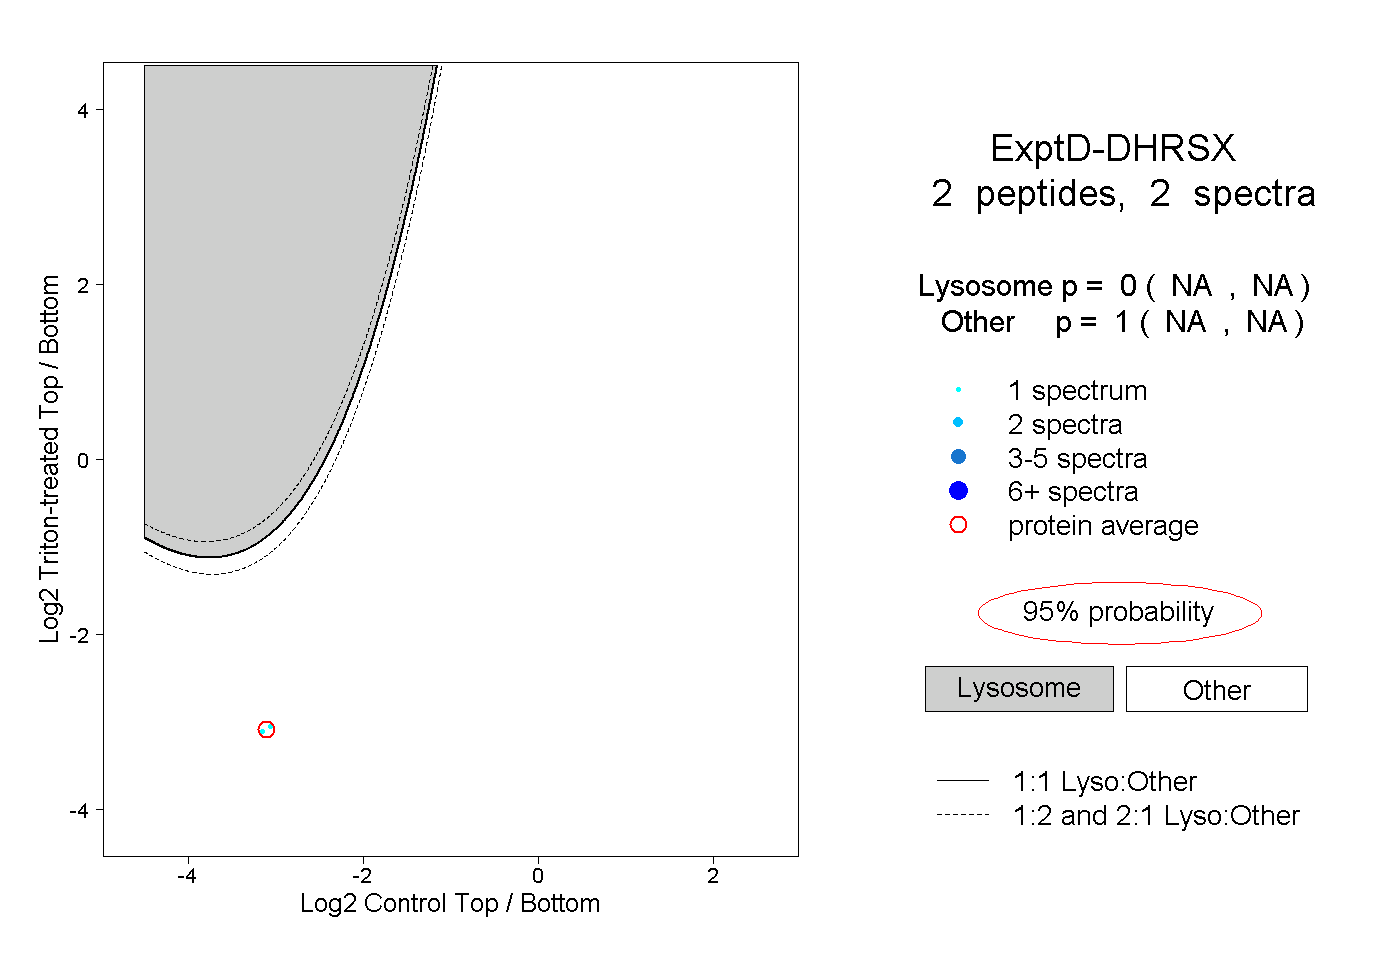
NA | NA
NA | NA