 3
3peptides
spectra
0.000 | 0.000
0.000 | 0.000
0.000 | 0.000
0.910 | 0.934
0.000 | 0.008
0.000 | 0.000
0.000 | 0.000
0.059 | 0.086
| Plot | Mito | Lyso | Perox | ER | Golgi | PM | Cytosol | Nucleus | |||||
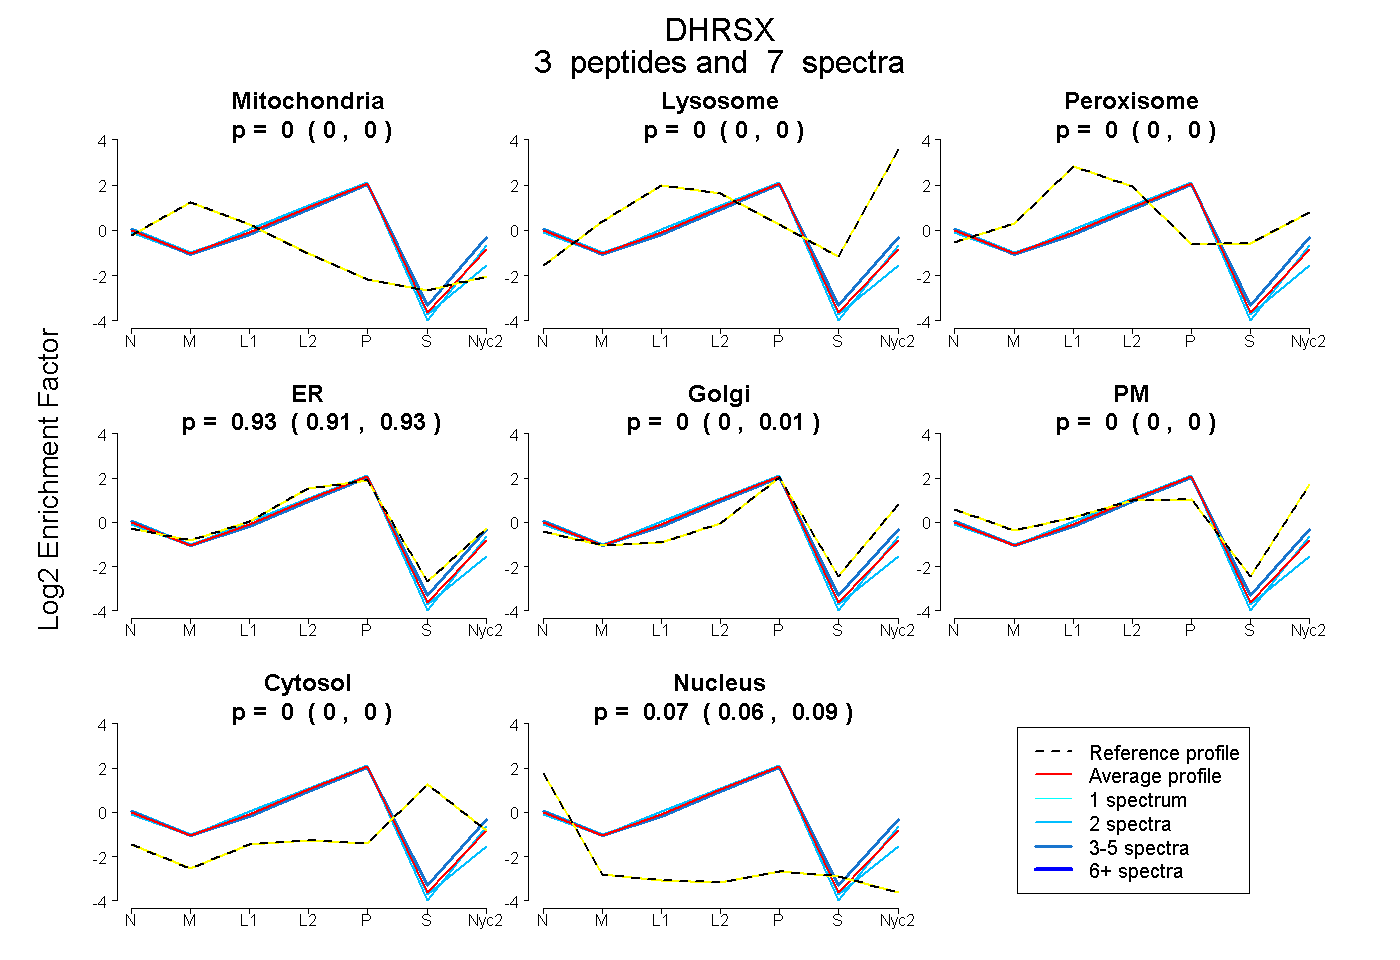
| Expt A |
3 peptides |
7 spectra |
|
0.000 0.000 | 0.000 |
0.000 0.000 | 0.000 |
0.000 0.000 | 0.000 |
0.926 0.910 | 0.934 |
0.000 0.000 | 0.008 |
0.000 0.000 | 0.000 |
0.000 0.000 | 0.000 |
0.074 0.059 | 0.086 |
| 2 spectra, GGFRPPELPLQADR | 0.000 | 0.000 | 0.000 | 0.934 | 0.000 | 0.000 | 0.000 | 0.066 | ||
| 2 spectra, GVGLSTACQLAR | 0.000 | 0.000 | 0.000 | 0.909 | 0.000 | 0.000 | 0.000 | 0.091 | ||
| 3 spectra, VAIVTGATR | 0.000 | 0.000 | 0.000 | 0.798 | 0.153 | 0.000 | 0.000 | 0.049 |
| Plot | Mito | Lyso or Perox | ER | Golgi | PM | Cytosol | Nucleus | ||||||
| Expt B |
3 peptides |
5 spectra |
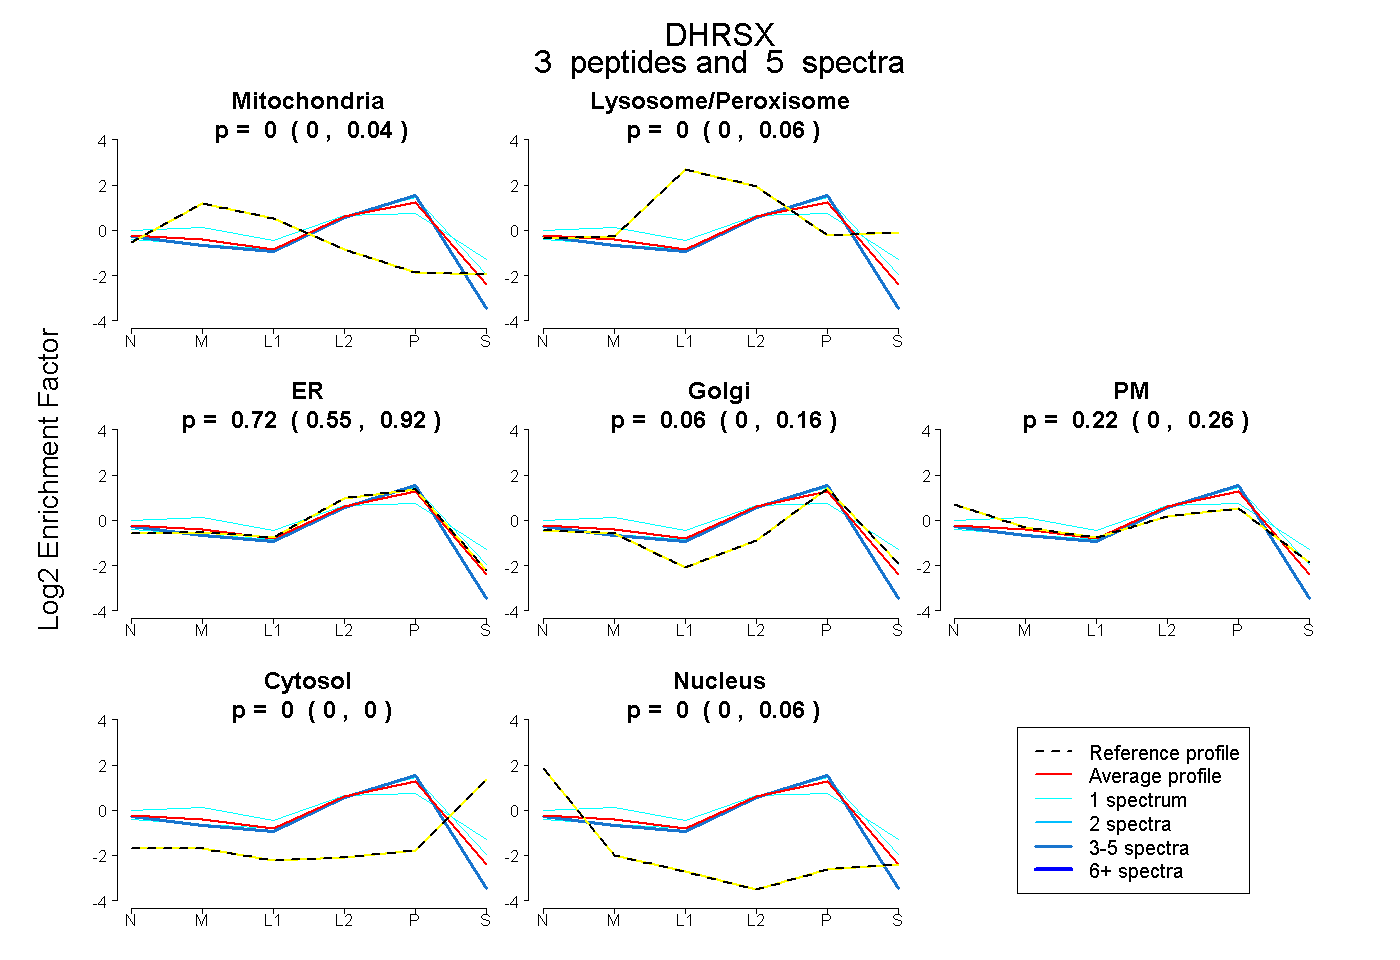 |
0.003 0.000 | 0.040 |
0.000 0.000 | 0.055 |
0.719 0.550 | 0.918 |
0.063 0.000 | 0.155 |
0.215 0.000 | 0.258 |
0.000 0.000 | 0.000 |
0.000 0.000 | 0.061 |
|||
| Plot | Lyso | Other | |||||||||||
| Expt C |
3 peptides |
8 spectra |
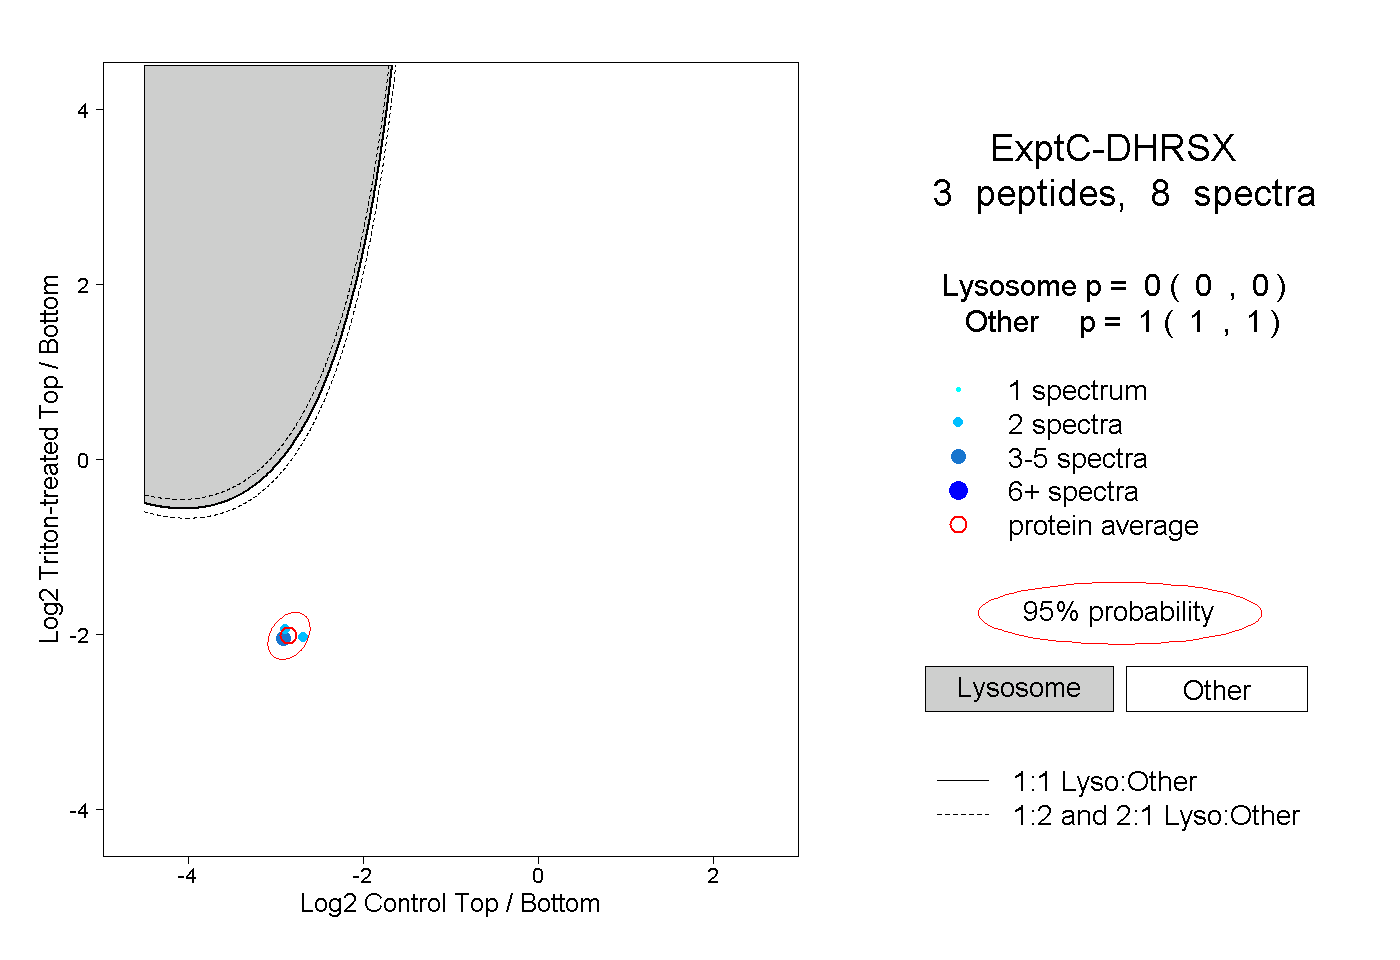 |
0.000 0.000 | 0.000 |
1.000 1.000 | 1.000 |
||||||||
| Plot | Lyso | Other | |||||||||||
| Expt D |
2 peptides |
2 spectra |
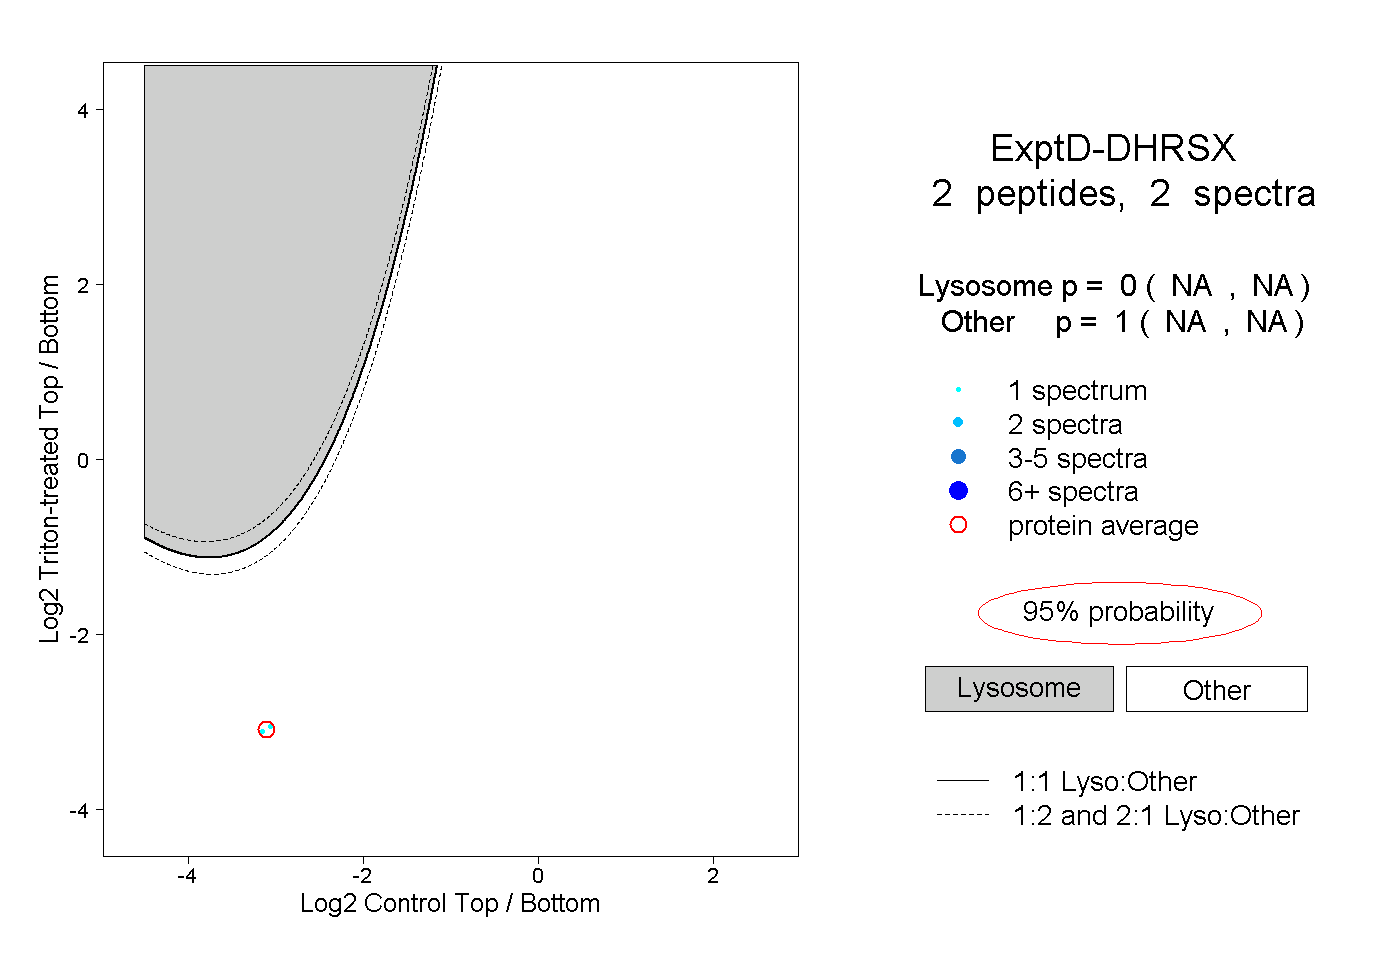 |
0.000 NA | NA |
1.000 NA | NA |