 6
6peptides
spectra
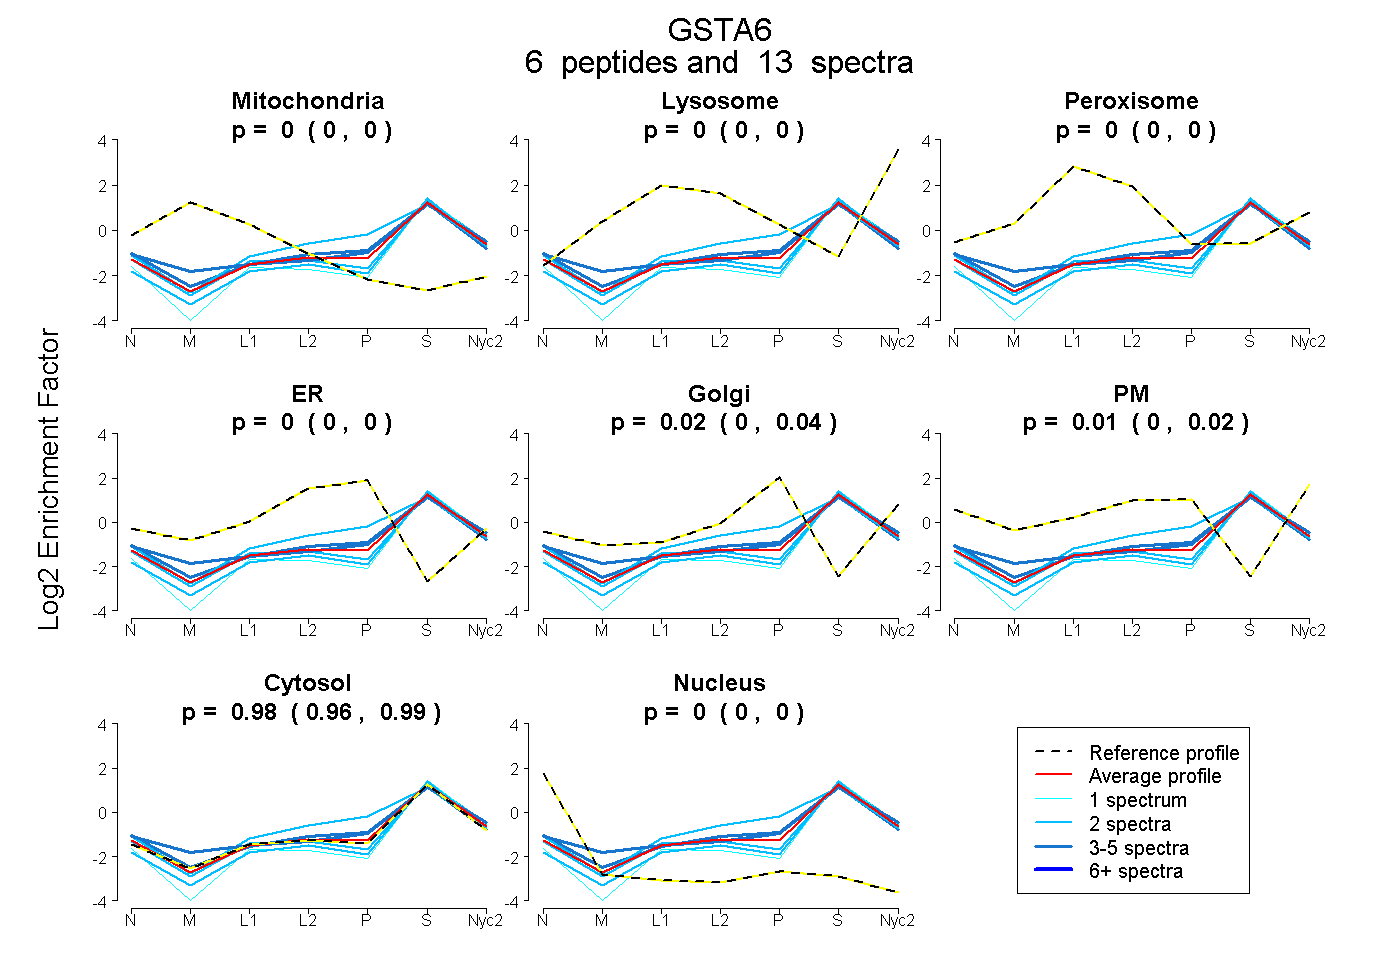
0.000 | 0.000
0.000 | 0.000
0.000 | 0.000
0.000 | 0.000
0.000 | 0.036
0.000 | 0.023
0.961 | 0.990
0.000 | 0.001
| Plot | Mito | Lyso | Perox | ER | Golgi | PM | Cytosol | Nucleus | |||||
| Expt A |
6 peptides |
13 spectra |
|
0.000 0.000 | 0.000 |
0.000 0.000 | 0.000 |
0.000 0.000 | 0.000 |
0.000 0.000 | 0.000 |
0.016 0.000 | 0.036 |
0.006 0.000 | 0.023 |
0.978 0.961 | 0.990 |
0.000 0.000 | 0.001 |
| 2 spectra, WLLAAAGVEYEEK | 0.000 | 0.000 | 0.000 | 0.000 | 0.000 | 0.000 | 1.000 | 0.000 | ||
| 1 spectrum, FIHTNEDLEK | 0.000 | 0.000 | 0.000 | 0.000 | 0.000 | 0.000 | 0.994 | 0.006 | ||
| 3 spectra, EANIALMK | 0.000 | 0.000 | 0.000 | 0.020 | 0.061 | 0.000 | 0.915 | 0.003 | ||
| 2 spectra, AIMNYFSSK | 0.000 | 0.000 | 0.000 | 0.000 | 0.000 | 0.000 | 1.000 | 0.000 | ||
| 2 spectra, QPPVDEK | 0.000 | 0.000 | 0.000 | 0.167 | 0.000 | 0.000 | 0.833 | 0.000 | ||
| 3 spectra, VFESHGQDYLVGNK | 0.017 | 0.007 | 0.000 | 0.000 | 0.055 | 0.041 | 0.880 | 0.000 |
| Plot | Mito | Lyso or Perox | ER | Golgi | PM | Cytosol | Nucleus | ||||||
| Expt B |
2 peptides |
2 spectra |
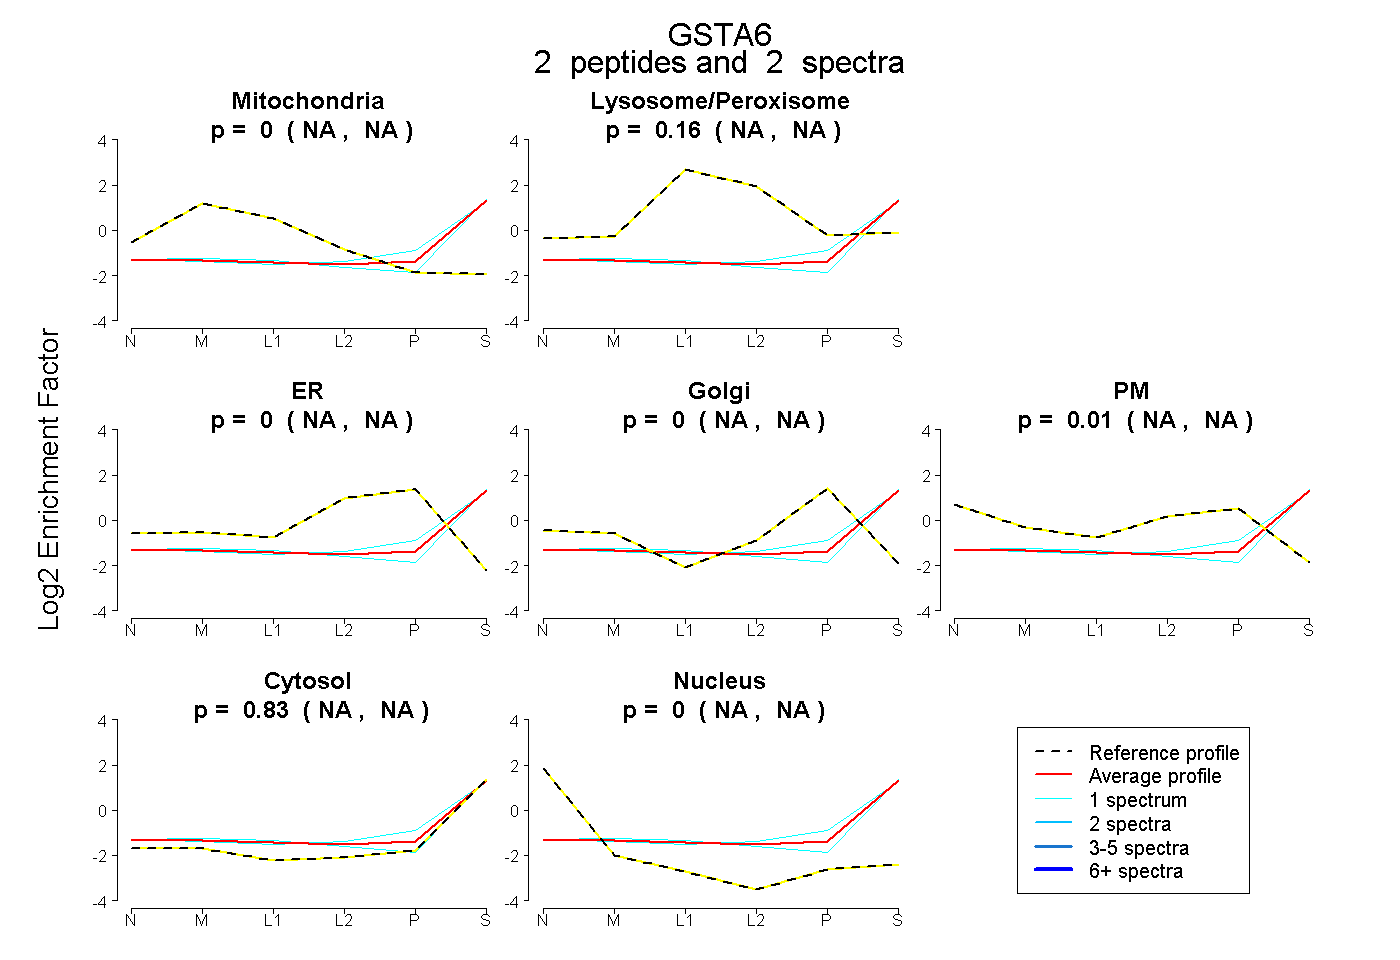 |
0.000 NA | NA |
0.158 NA | NA |
0.000 NA | NA |
0.000 NA | NA |
0.009 NA | NA |
0.833 NA | NA |
0.000 NA | NA |
|||
| Plot | Lyso | Other | |||||||||||
| Expt C |
4 peptides |
12 spectra |
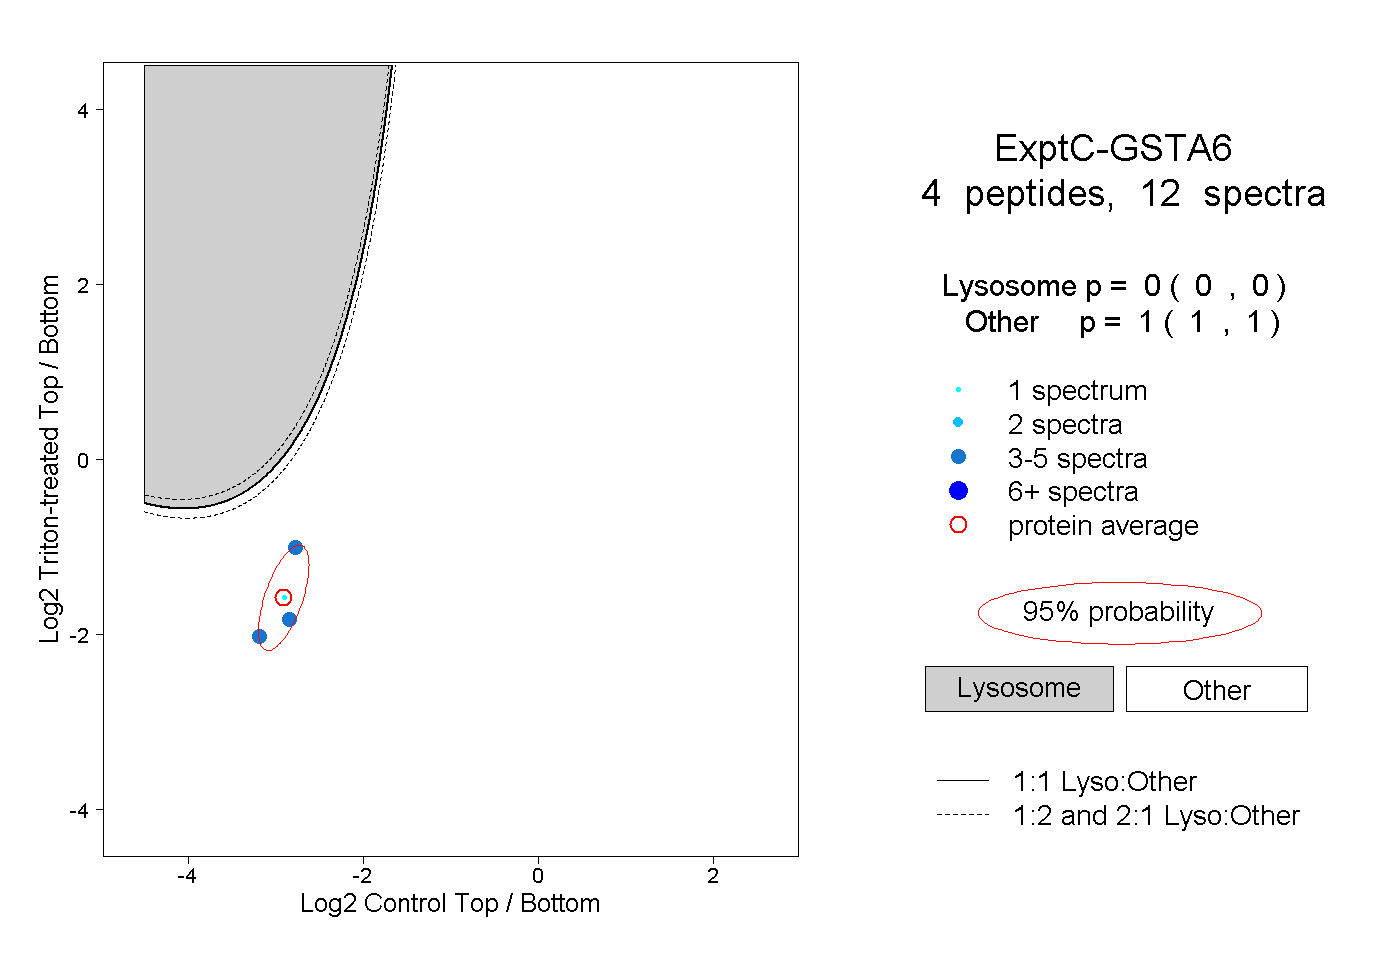 |
0.000 0.000 | 0.000 |
1.000 1.000 | 1.000 |