 13
13peptides
spectra
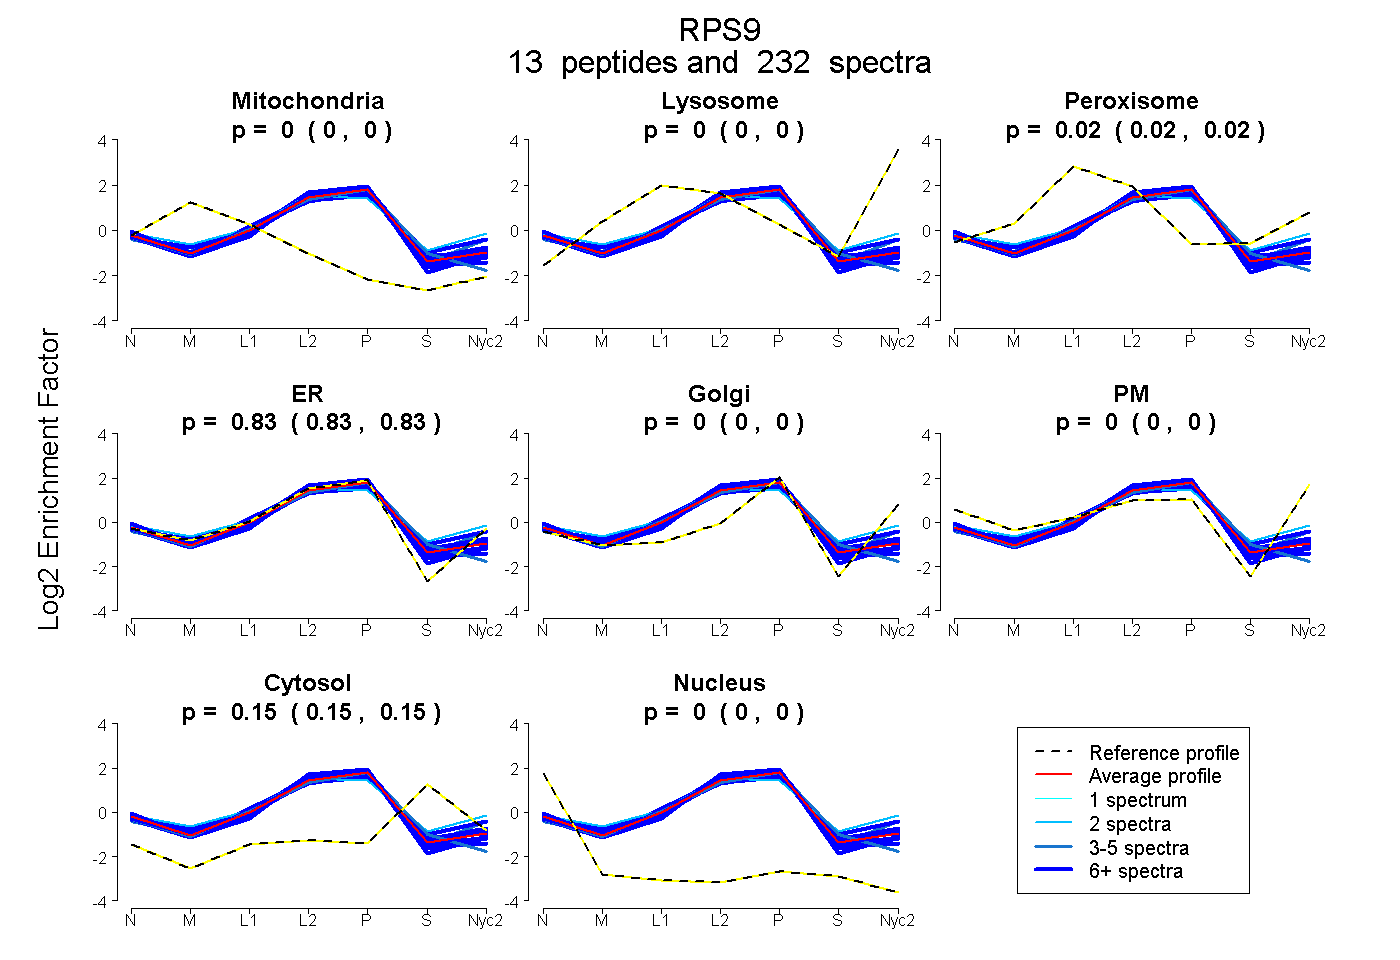
0.000 | 0.000
0.000 | 0.000
0.018 | 0.020
0.828 | 0.831
0.000 | 0.000
0.000 | 0.000
0.150 | 0.152
0.000 | 0.000
12peptides
spectra
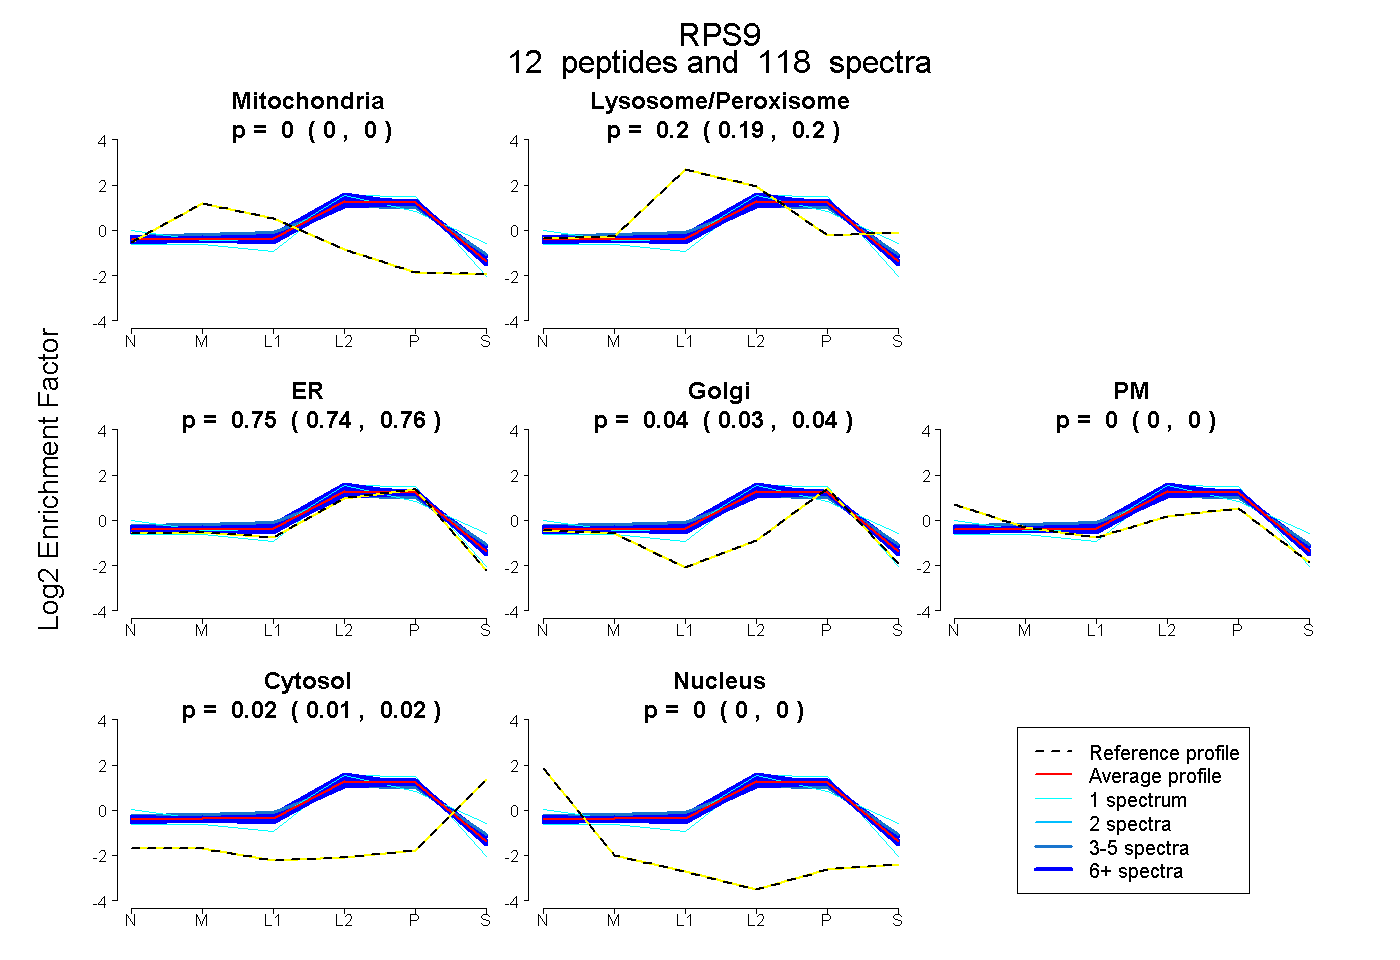
0.000 | 0.000
0.193 | 0.199
0.743 | 0.759
0.028 | 0.042
0.000 | 0.003
0.014 | 0.017
0.000 | 0.000
12peptides
spectra
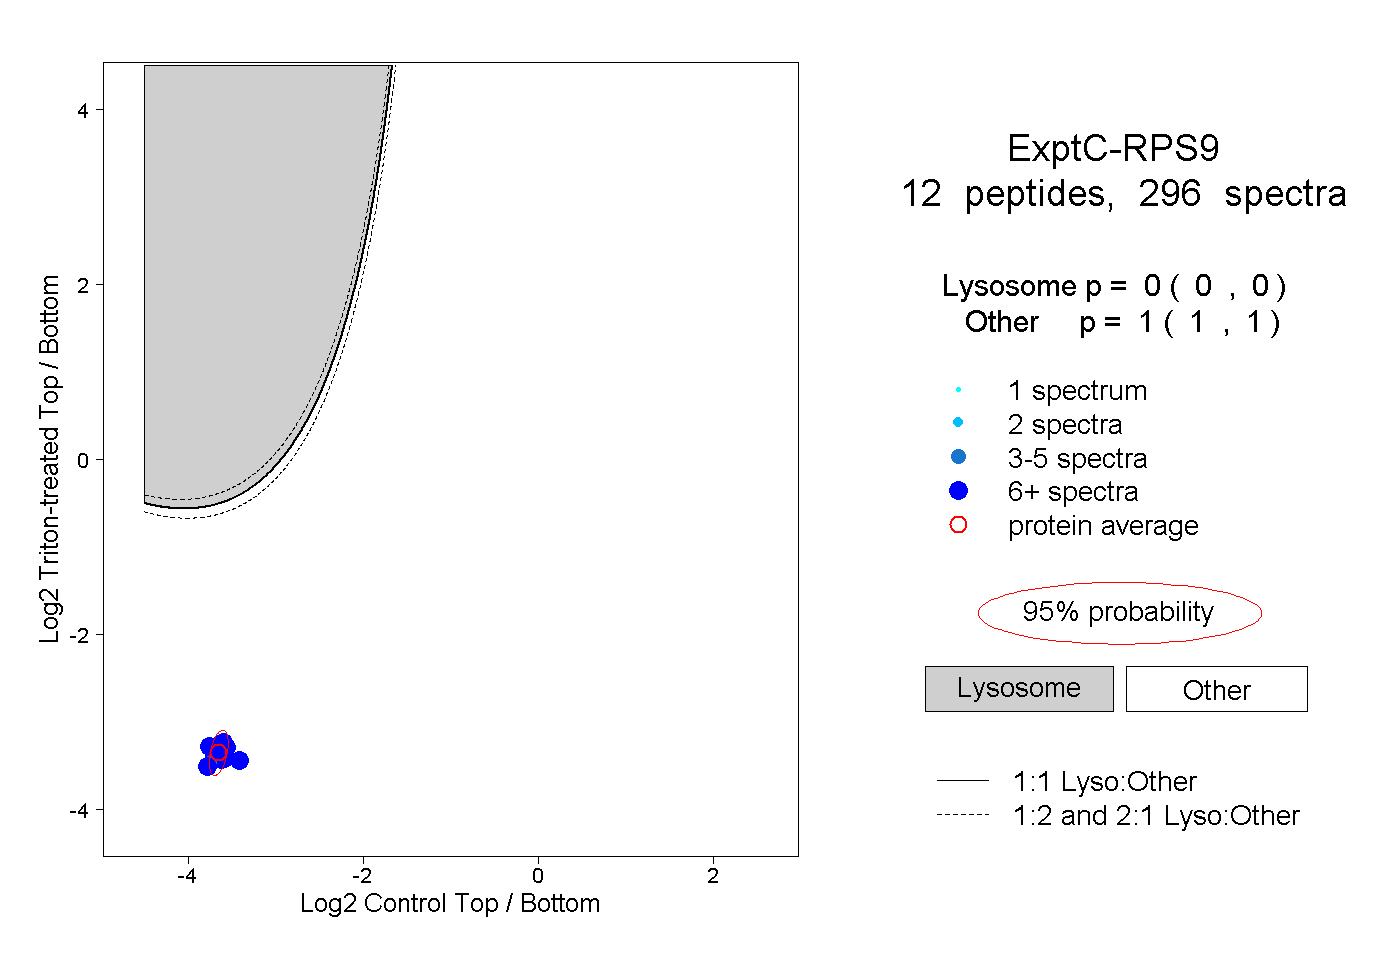
0.000 | 0.000
1.000 | 1.000
10peptides
spectra
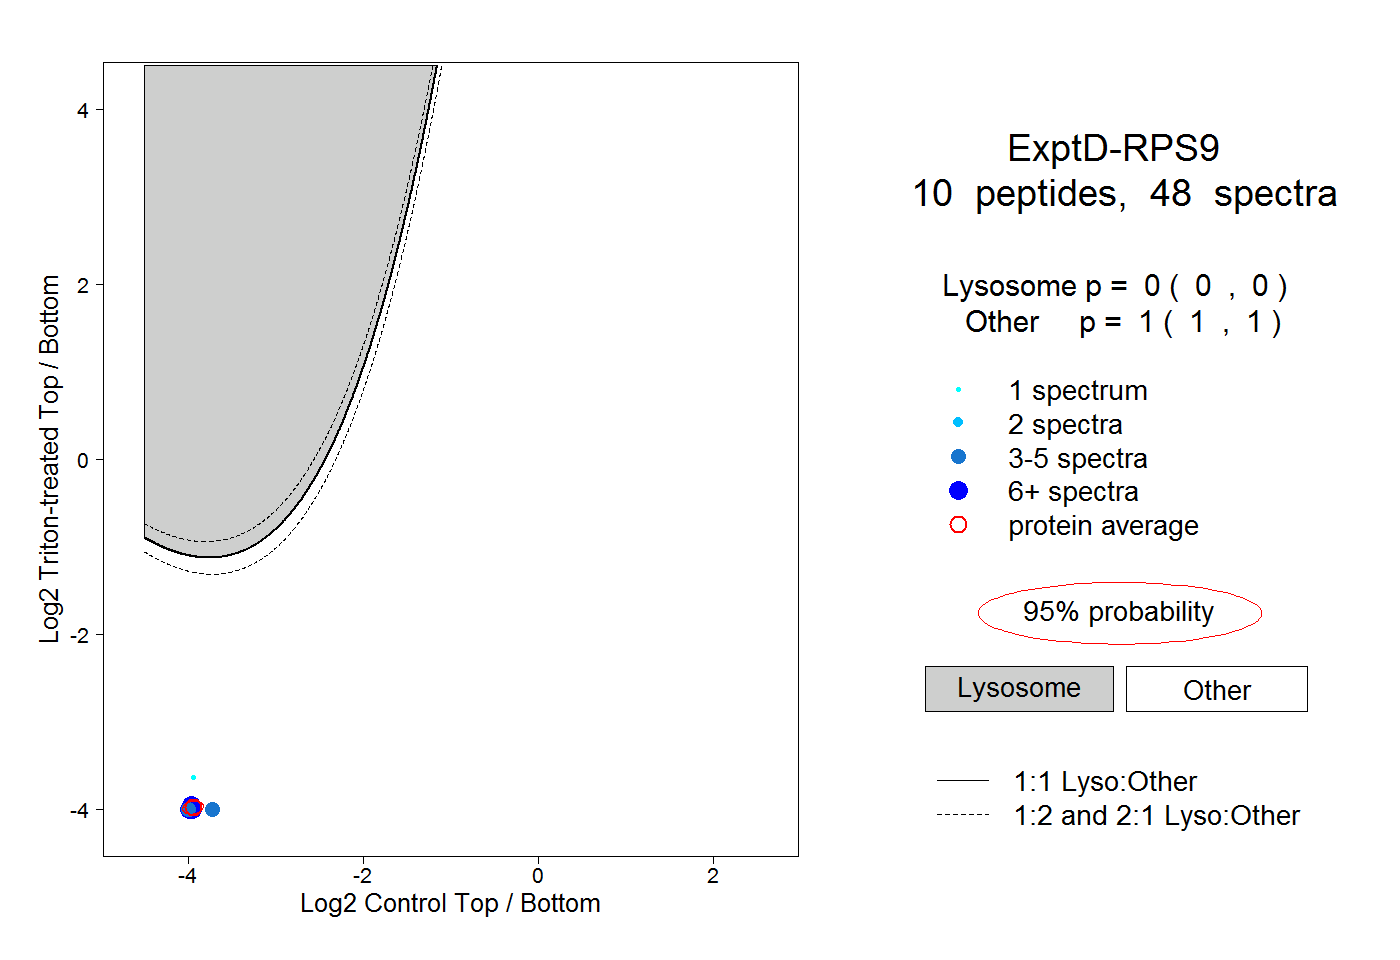
0.000 | 0.000
1.000 | 1.000