RPS9
[ENSRNOP00000031156]
Main page
| | | Plot |
Mito |
Lyso |
|
Perox |
ER |
Golgi |
PM |
Cytosol |
Nucleus |
|
| Expt A |
 13
13
peptides |
232
spectra |
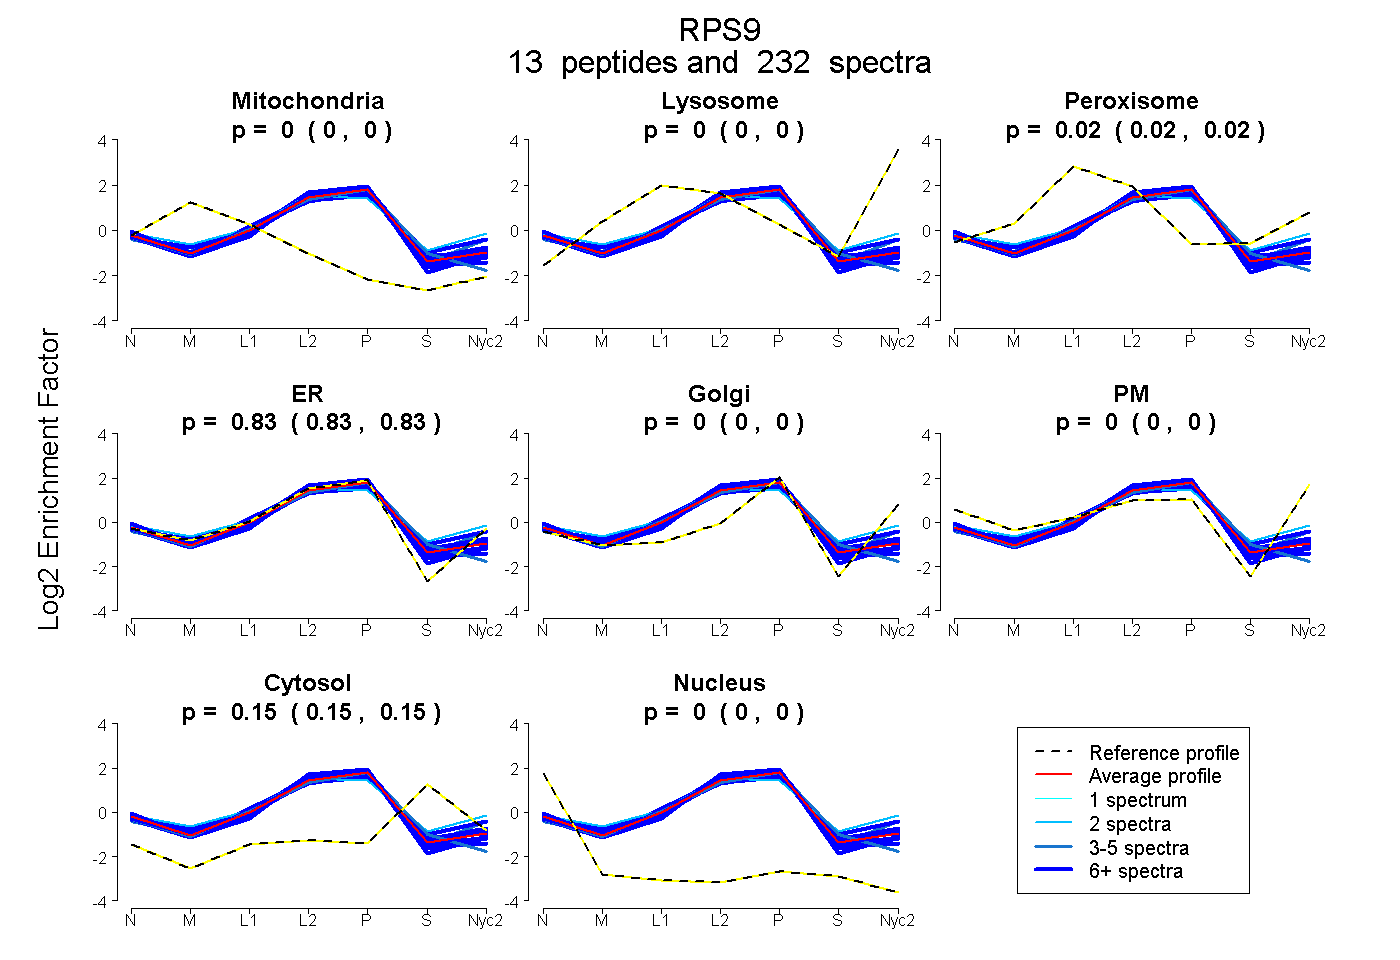 |
0.000
0.000 | 0.000 |
0.000
0.000 | 0.000 |
|
0.019
0.018 | 0.020 |
0.829
0.828 | 0.831 |
0.000
0.000 | 0.000 |
0.000
0.000 | 0.000 |
0.152
0.150 | 0.152 |
0.000
0.000 | 0.000 |
|
| | | Plot |
Mito |
|
Lyso or Perox |
|
ER |
Golgi |
PM |
Cytosol |
Nucleus |
|
| Expt B |
12
peptides |
118
spectra |
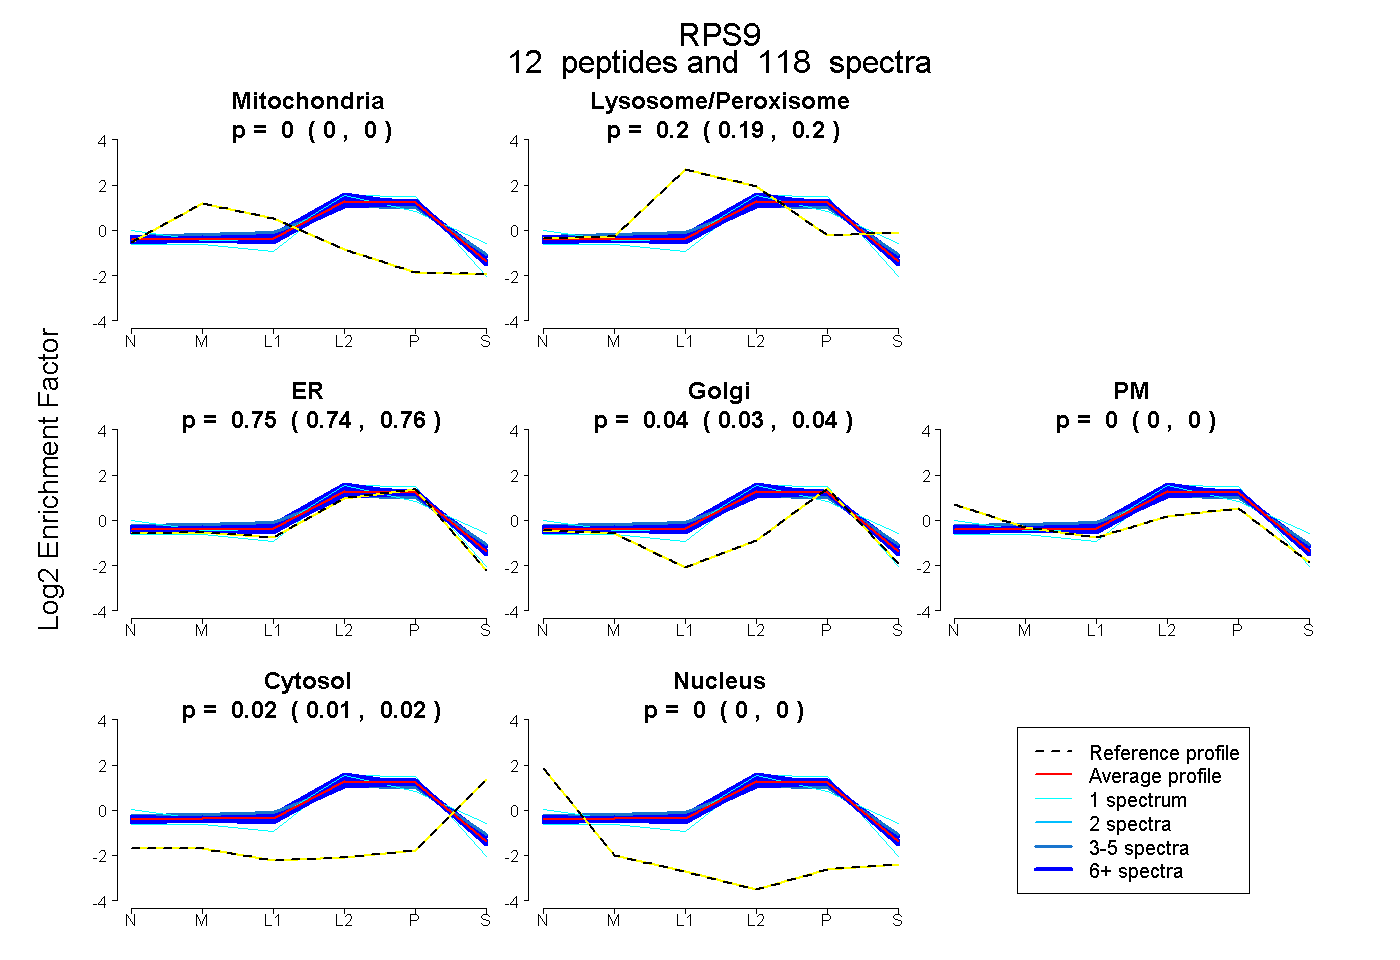 |
0.000
0.000 | 0.000 |
|
0.197
0.193 | 0.199 |
|
0.751
0.743 | 0.759 |
0.036
0.028 | 0.042 |
0.000
0.000 | 0.003 |
0.016
0.014 | 0.017 |
0.000
0.000 | 0.000 |
|
| | | Plot |
|
Lyso |
|
|
|
|
|
|
|
Other |
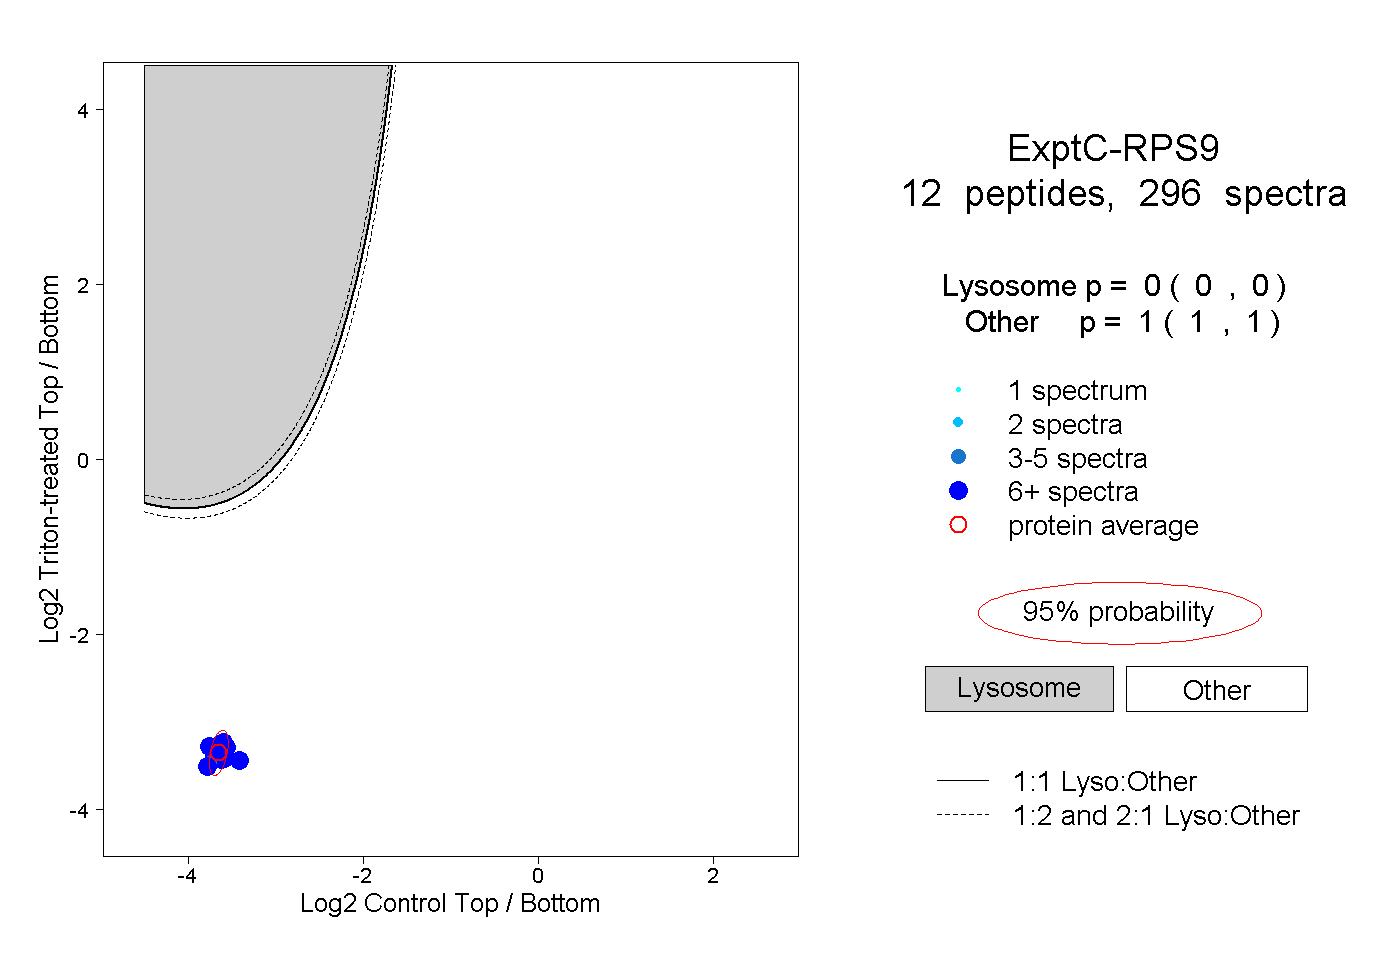
| Expt C |
12
peptides |
296
spectra |
 |
|
0.000
0.000 | 0.000 |
|
|
|
|
|
|
|
1.000
1.000 | 1.000 |
| 22 spectra, LQTQVFK |
|
0.000 |
|
|
|
|
|
|
|
1.000 |
| 17 spectra, IGVLDEGK |
|
0.000 |
|
|
|
|
|
|
|
1.000 |
| 29 spectra, LIGEYGLR |
|
0.000 |
|
|
|
|
|
|
|
1.000 |
| 32 spectra, HIDFSLR |
|
0.000 |
|
|
|
|
|
|
|
1.000 |
| 25 spectra, TYVTPR |
|
0.000 |
|
|
|
|
|
|
|
1.000 |
| 18 spectra, LDYILGLK |
|
0.000 |
|
|
|
|
|
|
|
1.000 |
| 8 spectra, ELLTLDEK |
|
0.000 |
|
|
|
|
|
|
|
1.000 |
| 18 spectra, LFEGNALLR |
|
0.000 |
|
|
|
|
|
|
|
1.000 |
| 54 spectra, SPYGGGRPGR |
|
0.000 |
|
|
|
|
|
|
|
1.000 |
| 21 spectra, QVVNIPSFIVR |
|
0.000 |
|
|
|
|
|
|
|
1.000 |
| 3 spectra, SWVCR |
|
0.000 |
|
|
|
|
|
|
|
1.000 |
| 49 spectra, IEDFLER |
|
0.000 |
|
|
|
|
|
|
|
1.000 |
| | | Plot |
|
Lyso |
|
|
|
|
|
|
|
Other |
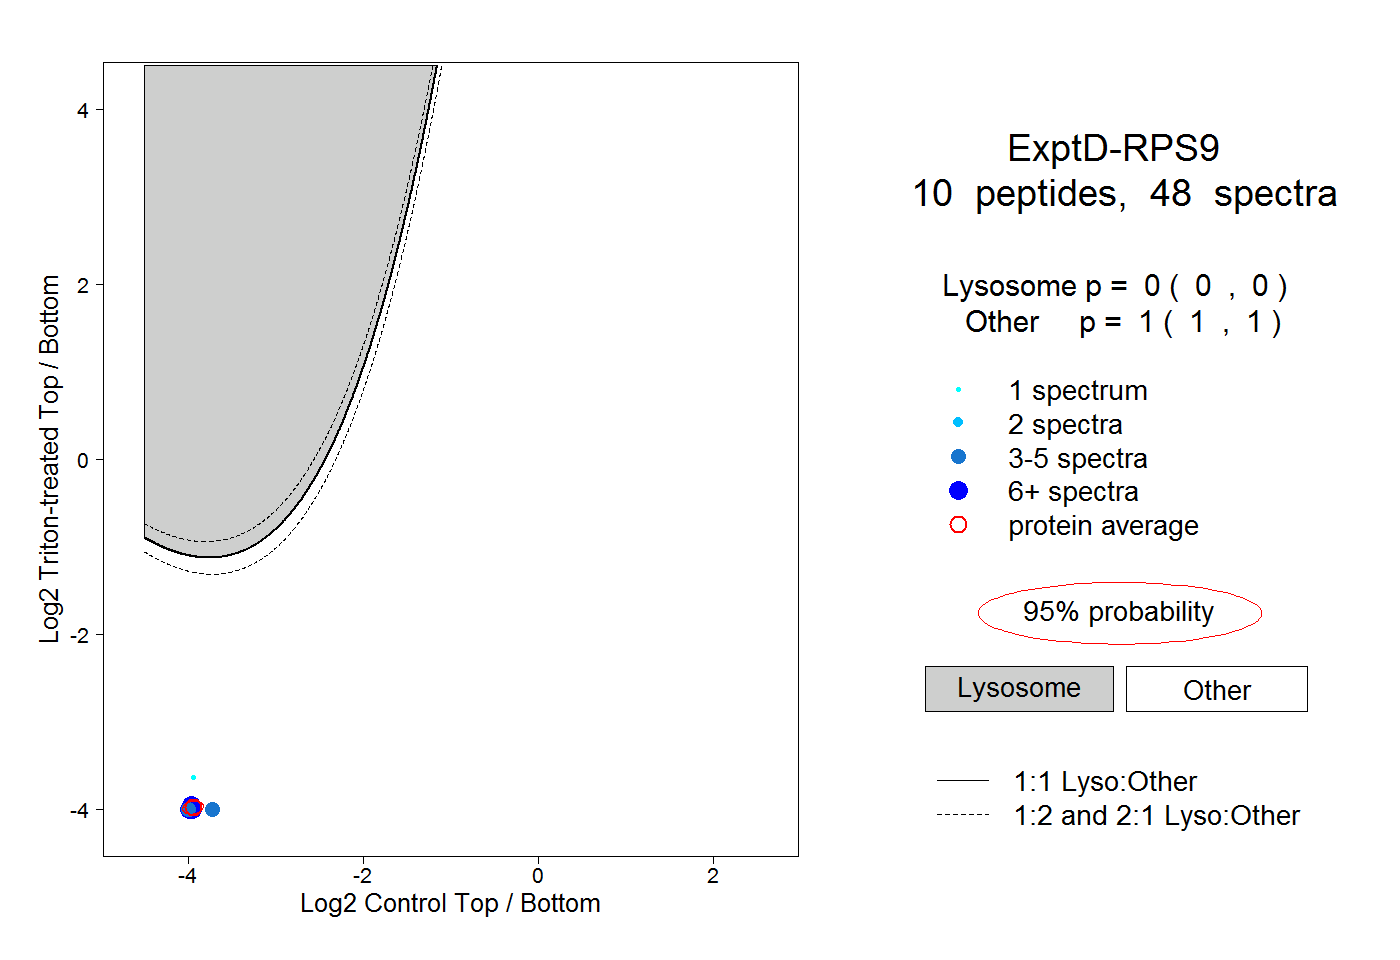
| Expt D |
10
peptides |
48
spectra |
 |
|
0.000
0.000 | 0.000 |
|
|
|
|
|
|
|
1.000
1.000 | 1.000 |