 13
13peptides
spectra
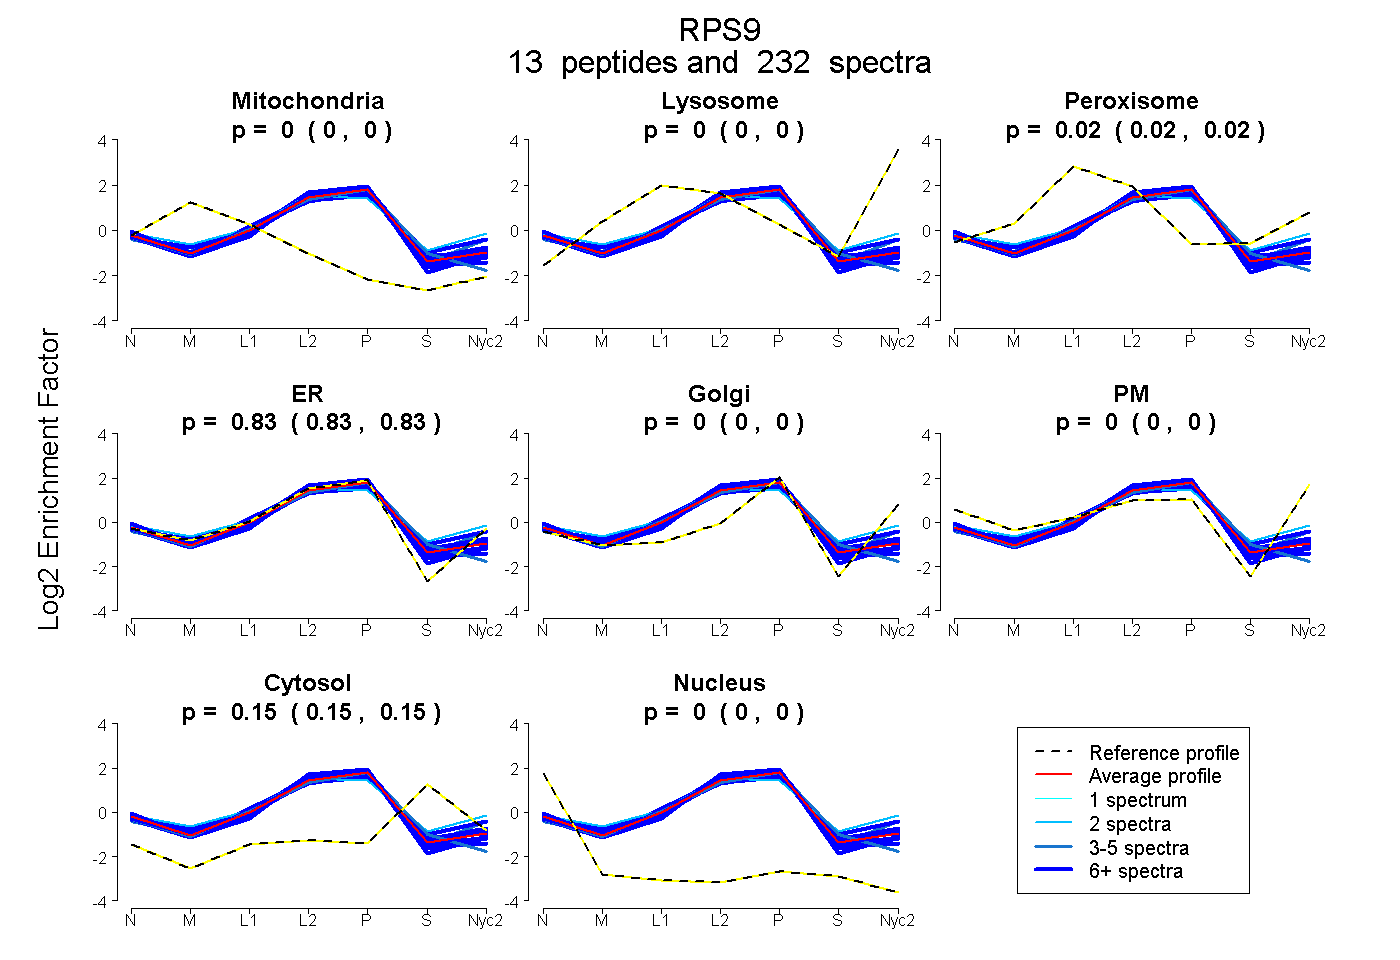
0.000 | 0.000
0.000 | 0.000
0.018 | 0.020
0.828 | 0.831
0.000 | 0.000
0.000 | 0.000
0.150 | 0.152
0.000 | 0.000
| Plot | Mito | Lyso | Perox | ER | Golgi | PM | Cytosol | Nucleus | |||||
| Expt A |
13 peptides |
232 spectra |
|
0.000 0.000 | 0.000 |
0.000 0.000 | 0.000 |
0.019 0.018 | 0.020 |
0.829 0.828 | 0.831 |
0.000 0.000 | 0.000 |
0.000 0.000 | 0.000 |
0.152 0.150 | 0.152 |
0.000 0.000 | 0.000 |
| 8 spectra, LQTQVFK | 0.000 | 0.000 | 0.000 | 0.841 | 0.000 | 0.000 | 0.159 | 0.000 | ||
| 18 spectra, IGVLDEGK | 0.000 | 0.000 | 0.044 | 0.772 | 0.000 | 0.000 | 0.185 | 0.000 | ||
| 16 spectra, LIGEYGLR | 0.000 | 0.000 | 0.113 | 0.707 | 0.000 | 0.000 | 0.180 | 0.000 | ||
| 2 spectra, SIHHAR | 0.000 | 0.000 | 0.185 | 0.660 | 0.000 | 0.000 | 0.154 | 0.000 | ||
| 34 spectra, HIDFSLR | 0.000 | 0.000 | 0.021 | 0.830 | 0.000 | 0.000 | 0.149 | 0.000 | ||
| 34 spectra, TYVTPR | 0.000 | 0.000 | 0.007 | 0.864 | 0.000 | 0.000 | 0.129 | 0.000 | ||
| 7 spectra, LDYILGLK | 0.000 | 0.000 | 0.000 | 0.883 | 0.000 | 0.000 | 0.117 | 0.000 | ||
| 4 spectra, ELLTLDEK | 0.000 | 0.000 | 0.057 | 0.819 | 0.000 | 0.000 | 0.124 | 0.000 | ||
| 9 spectra, LFEGNALLR | 0.000 | 0.000 | 0.000 | 0.900 | 0.000 | 0.000 | 0.100 | 0.000 | ||
| 41 spectra, SPYGGGRPGR | 0.000 | 0.000 | 0.000 | 0.850 | 0.000 | 0.000 | 0.136 | 0.014 | ||
| 15 spectra, QVVNIPSFIVR | 0.000 | 0.000 | 0.054 | 0.795 | 0.000 | 0.000 | 0.151 | 0.000 | ||
| 5 spectra, SWVCR | 0.000 | 0.000 | 0.000 | 0.791 | 0.000 | 0.000 | 0.209 | 0.000 | ||
| 39 spectra, IEDFLER | 0.000 | 0.000 | 0.000 | 0.861 | 0.000 | 0.000 | 0.139 | 0.000 |
| Plot | Mito | Lyso or Perox | ER | Golgi | PM | Cytosol | Nucleus | ||||||
| Expt B |
12 peptides |
118 spectra |
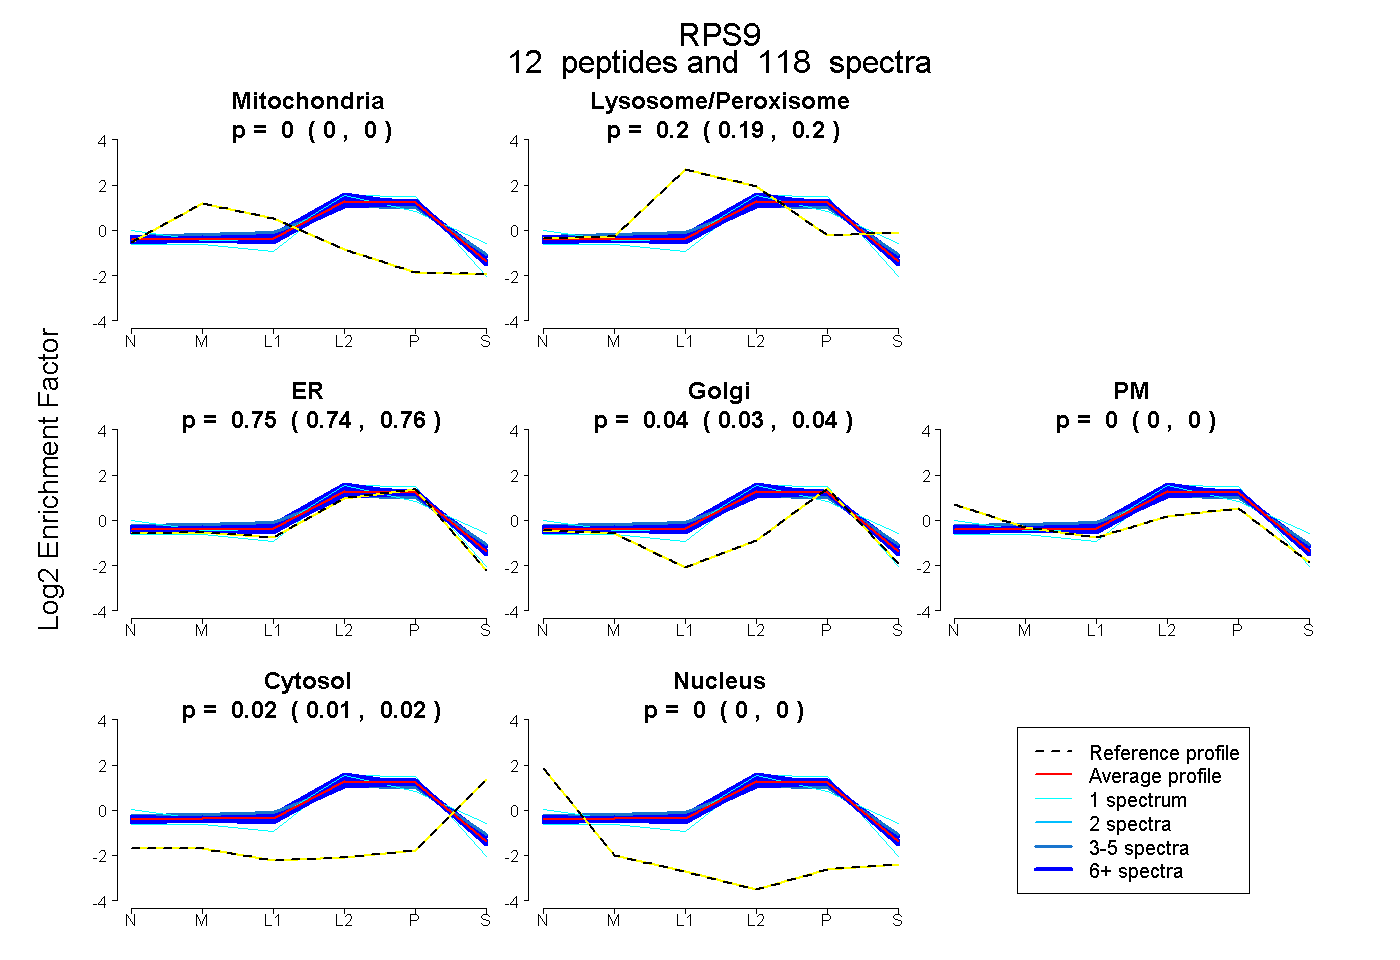 |
0.000 0.000 | 0.000 |
0.197 0.193 | 0.199 |
0.751 0.743 | 0.759 |
0.036 0.028 | 0.042 |
0.000 0.000 | 0.003 |
0.016 0.014 | 0.017 |
0.000 0.000 | 0.000 |
|||
| Plot | Lyso | Other | |||||||||||
| Expt C |
12 peptides |
296 spectra |
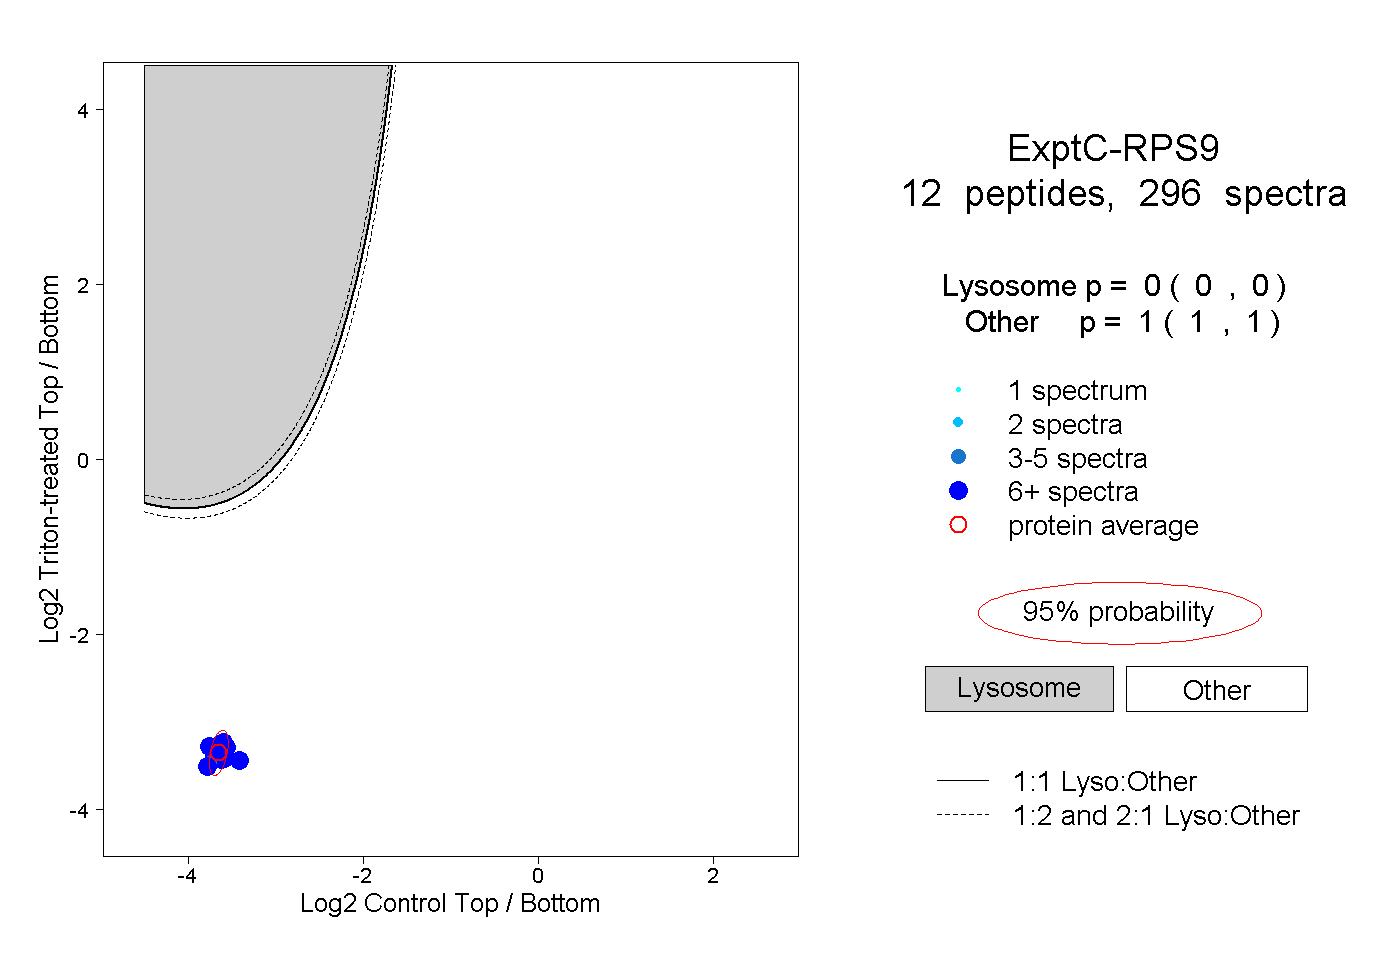 |
0.000 0.000 | 0.000 |
1.000 1.000 | 1.000 |
||||||||
| Plot | Lyso | Other | |||||||||||
| Expt D |
10 peptides |
48 spectra |
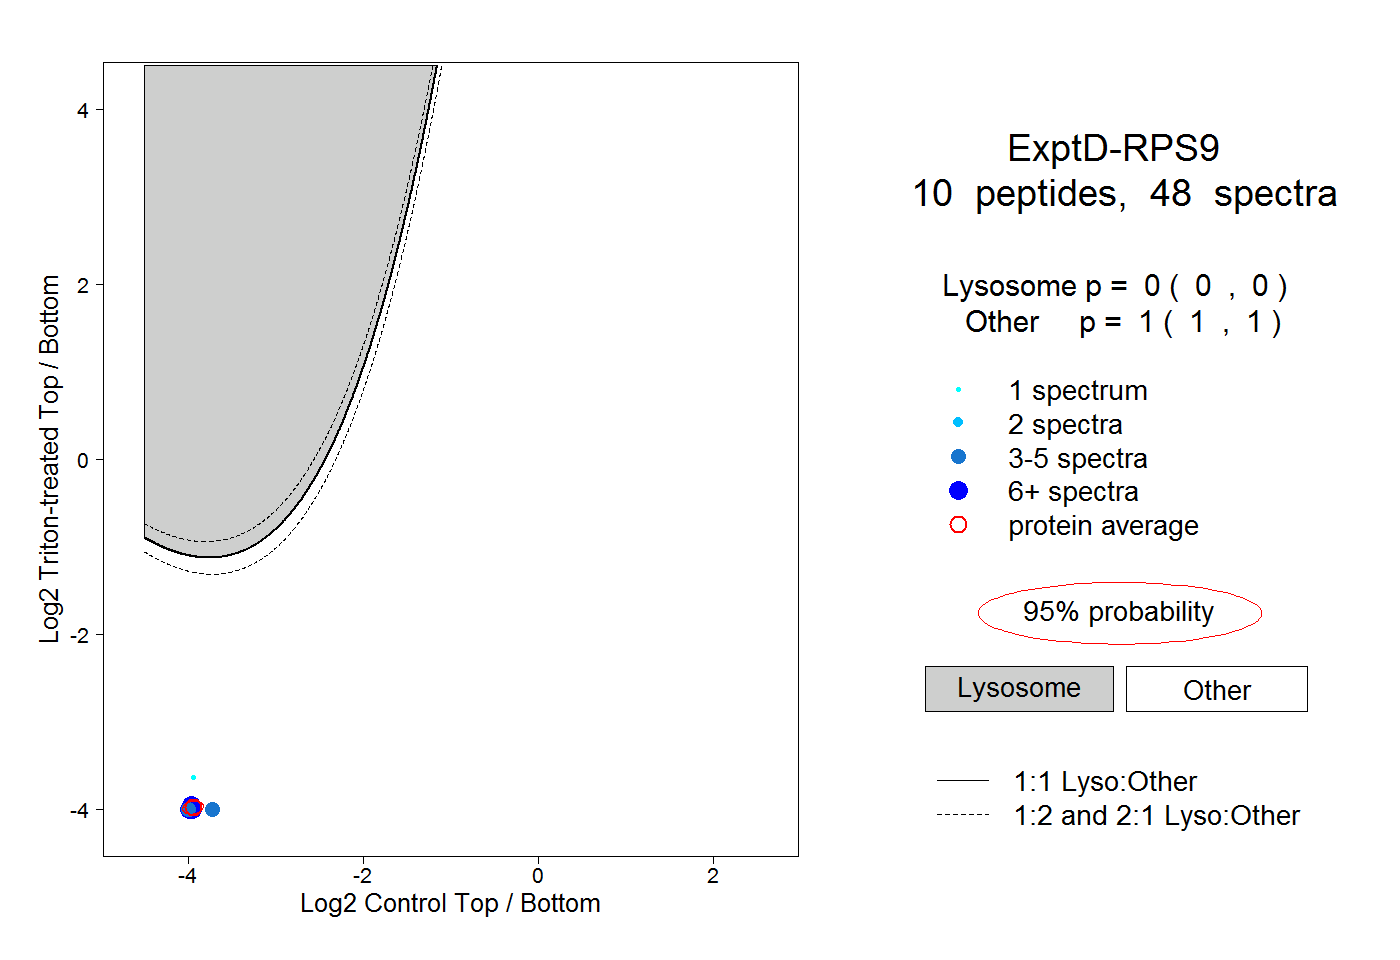 |
0.000 0.000 | 0.000 |
1.000 1.000 | 1.000 |