 20
20peptides
spectra
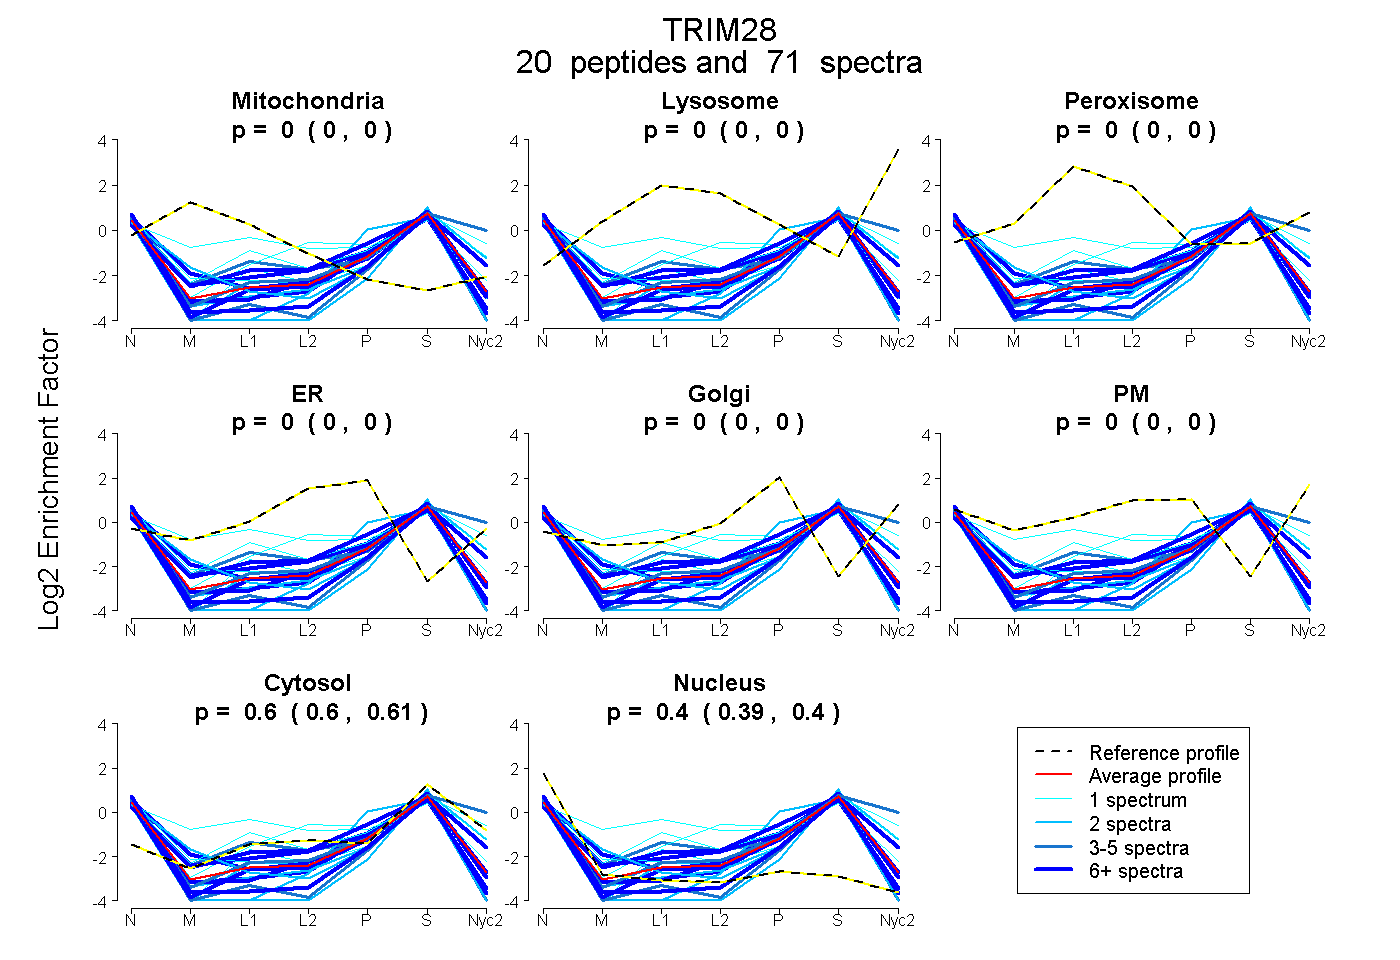
0.000 | 0.000
0.000 | 0.000
0.000 | 0.000
0.000 | 0.000
0.000 | 0.000
0.000 | 0.000
0.596 | 0.605
0.394 | 0.403
5peptides
spectra
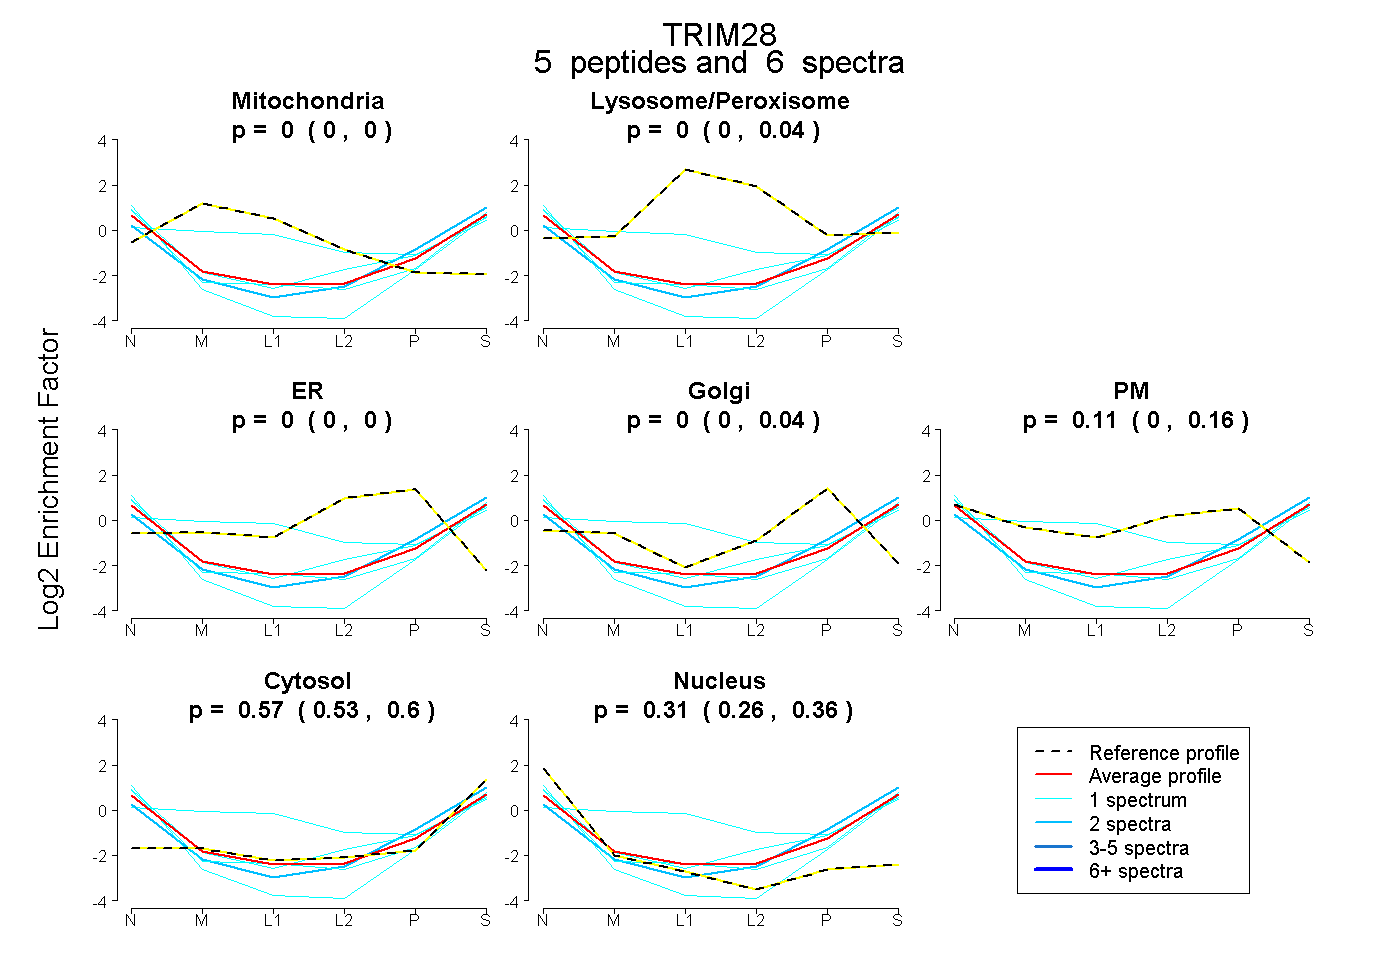
0.000 | 0.000
0.000 | 0.043
0.000 | 0.000
0.000 | 0.042
0.000 | 0.160
0.534 | 0.596
0.260 | 0.361
3peptides
spectra
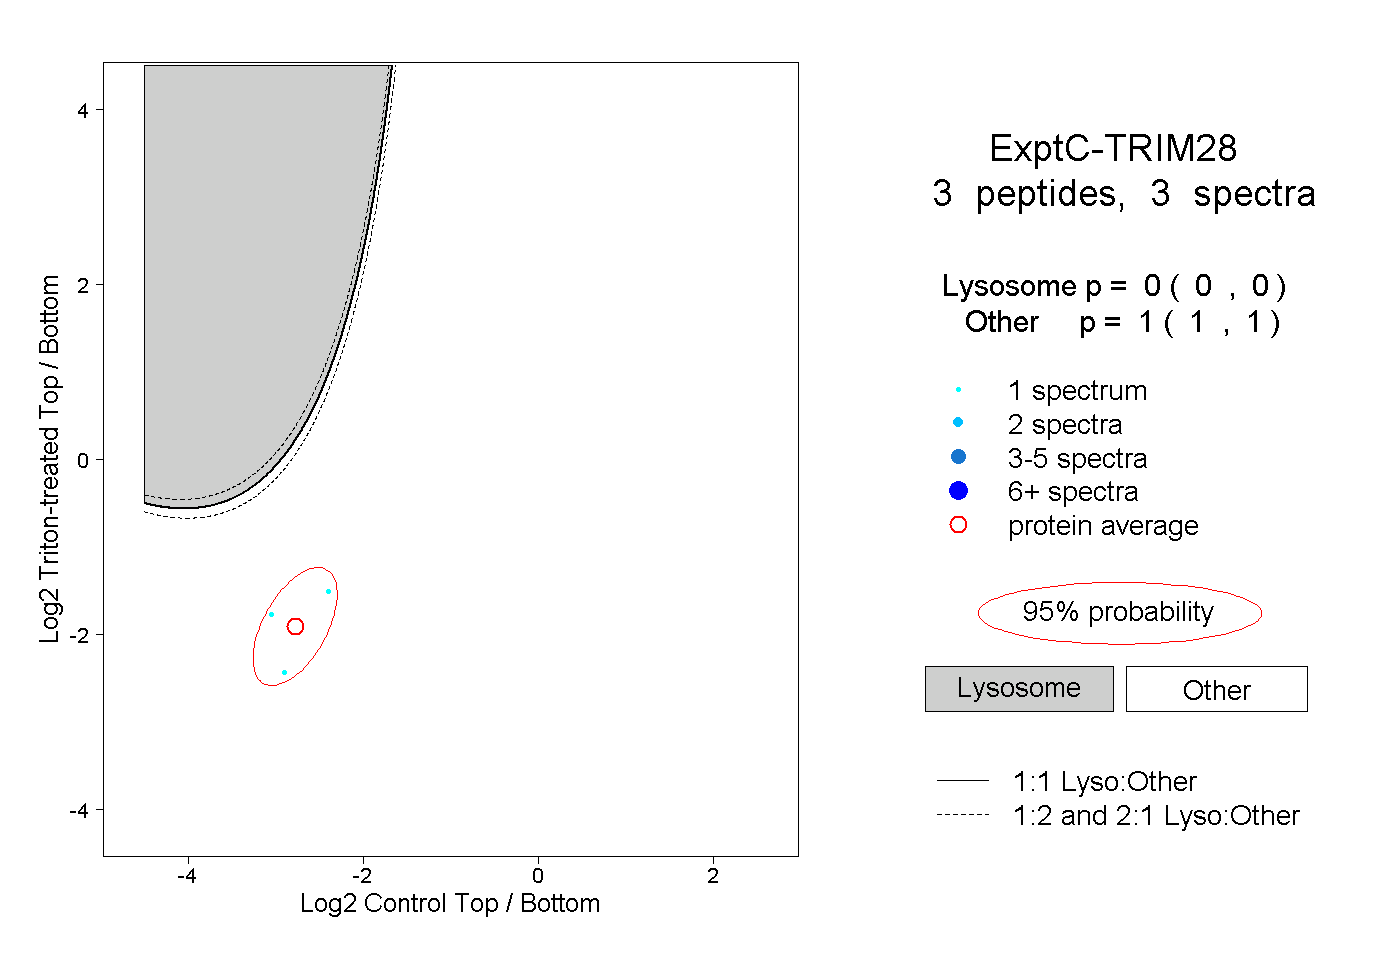
0.000 | 0.000
1.000 | 1.000