 2
2peptides
spectra
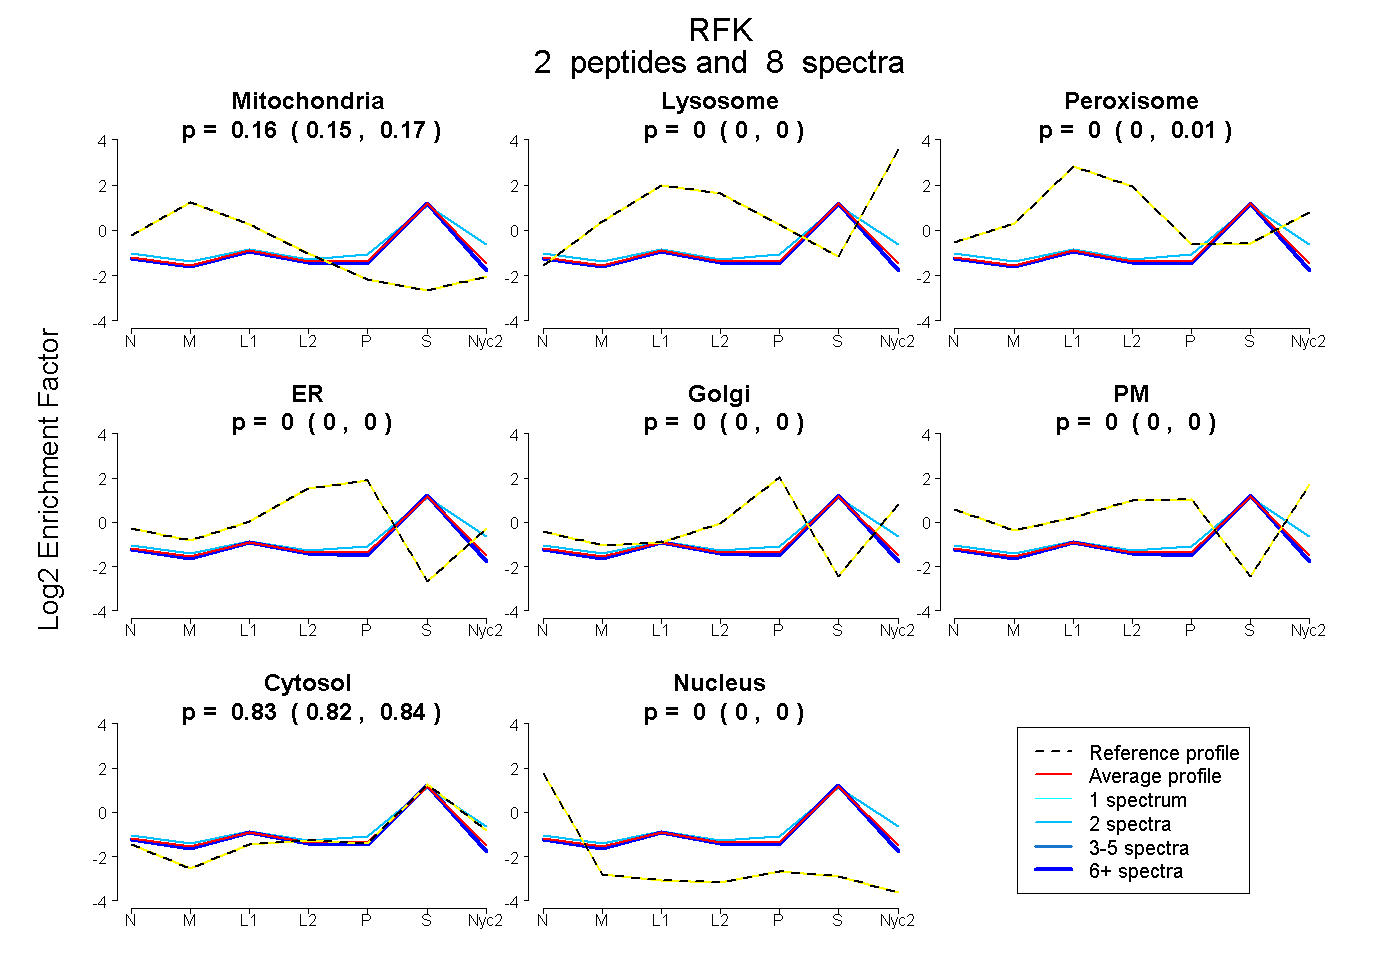
0.148 | 0.175
0.000 | 0.000
0.000 | 0.015
0.000 | 0.000
0.000 | 0.000
0.000 | 0.000
0.822 | 0.842
0.000 | 0.000
1peptide
spectra
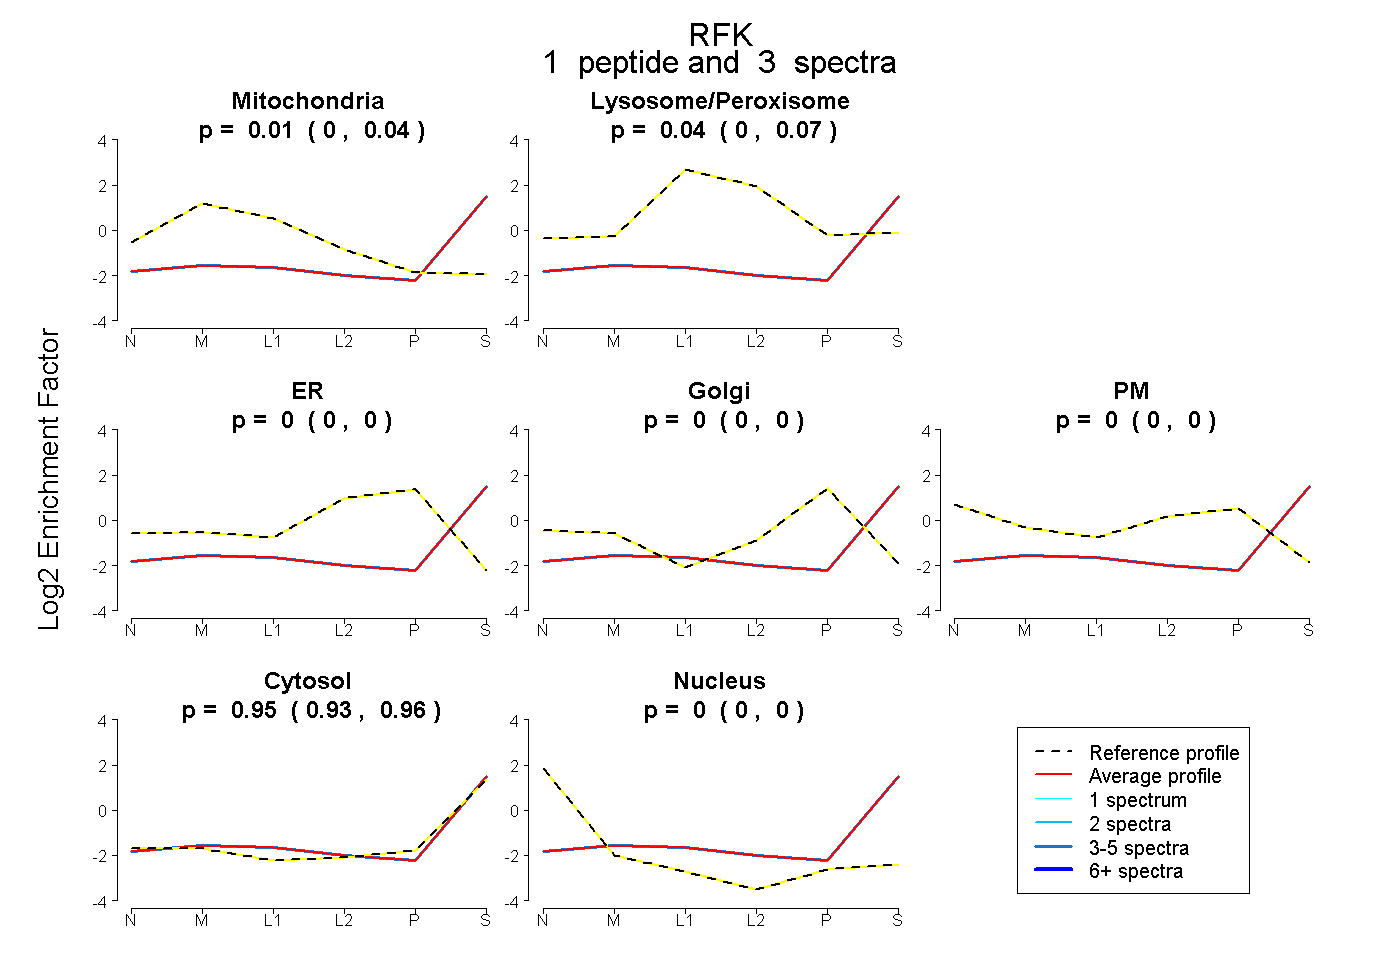
0.000 | 0.043
0.000 | 0.067
0.000 | 0.000
0.000 | 0.000
0.000 | 0.000
0.929 | 0.961
0.000 | 0.000
2peptides
spectra
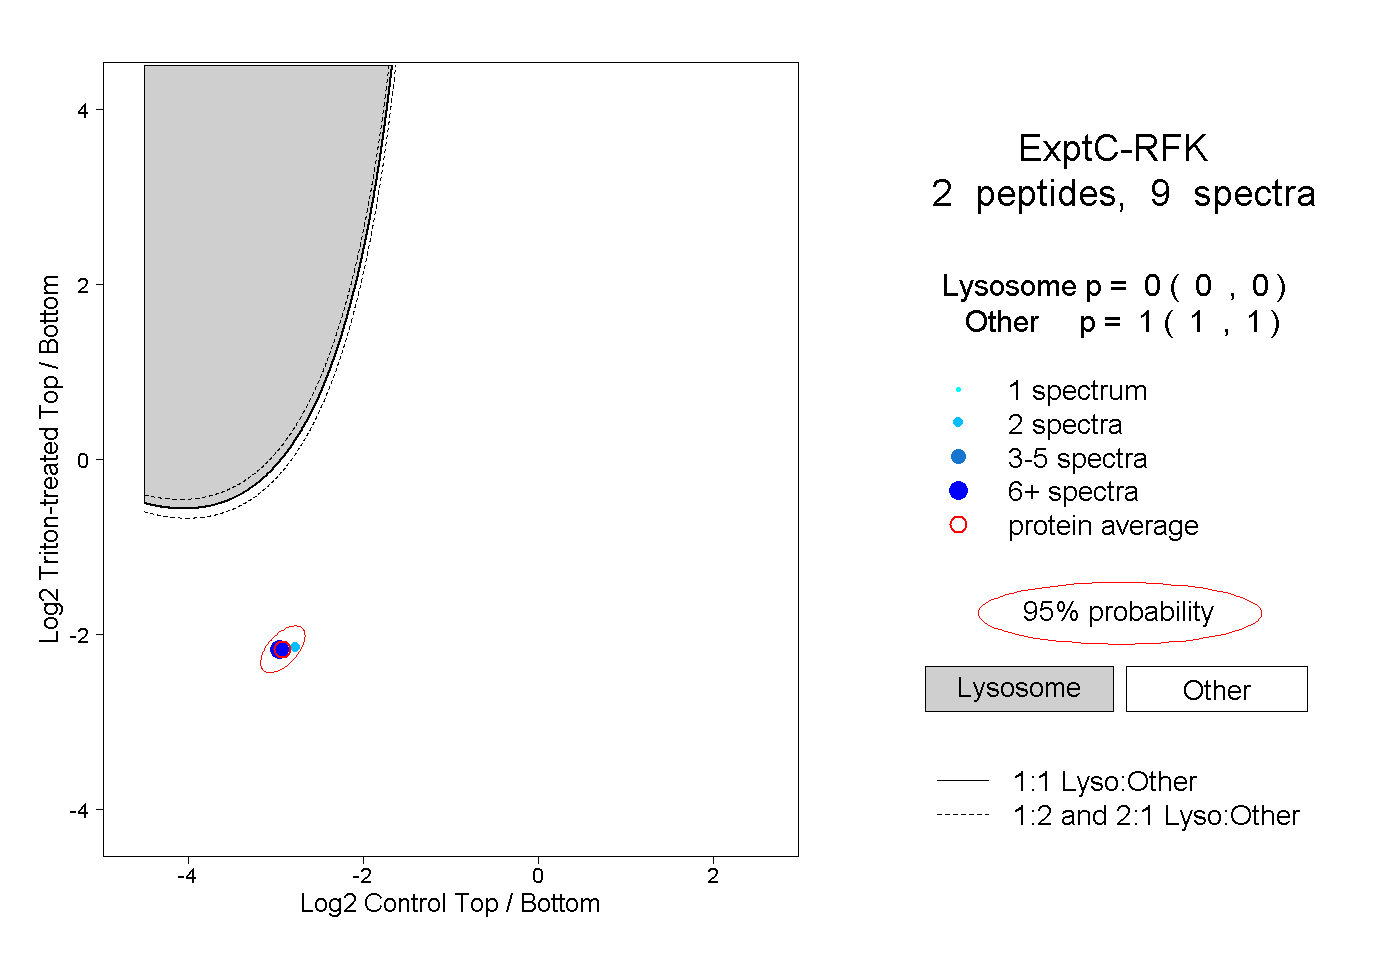
0.000 | 0.000
1.000 | 1.000