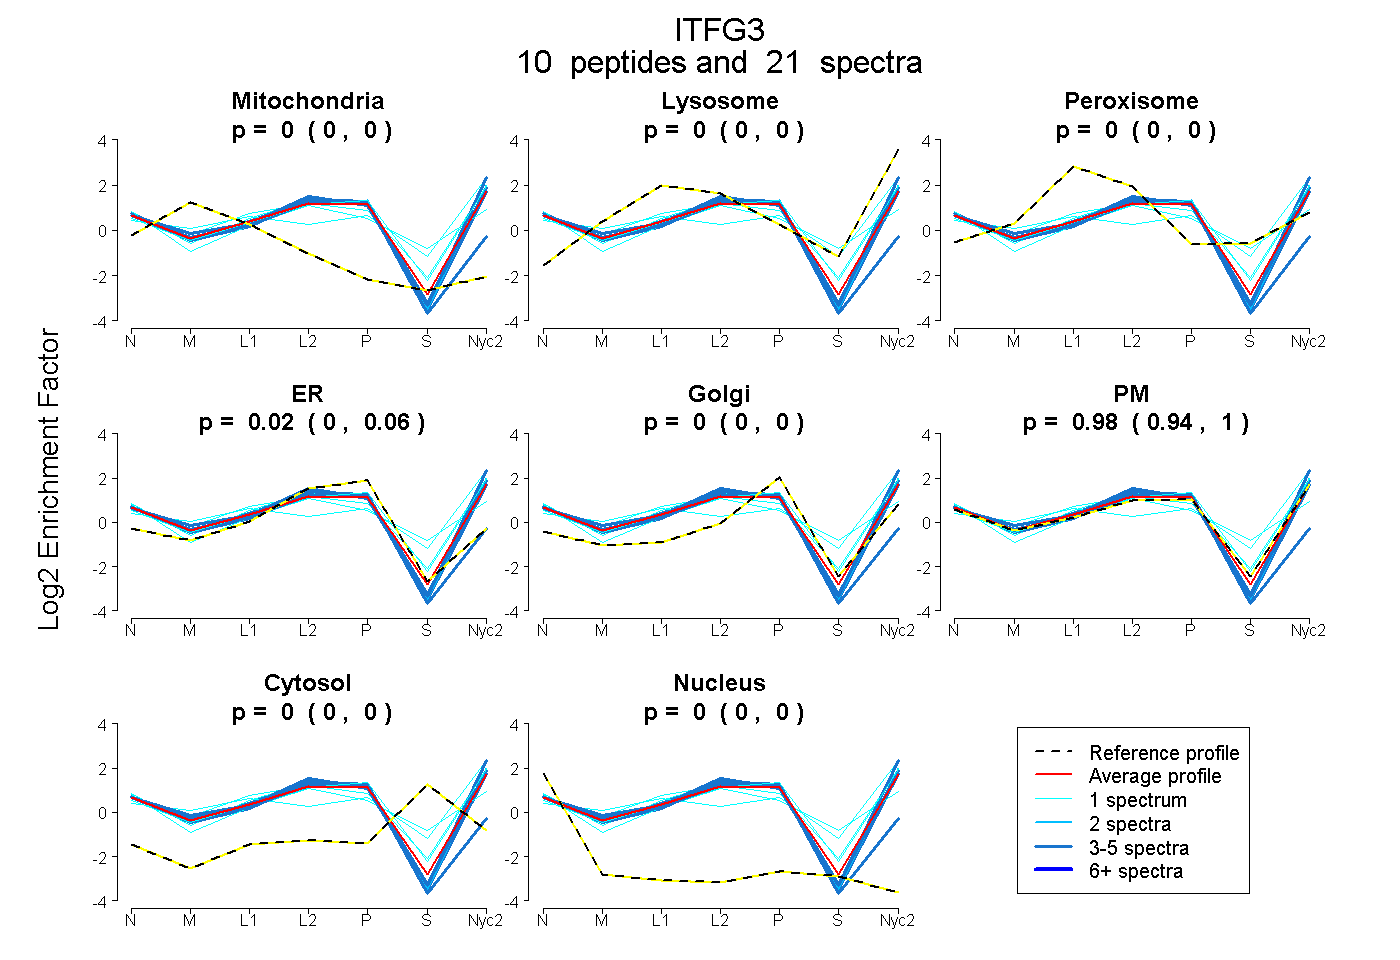
 10
10peptides
spectra
0.000 | 0.000
0.000 | 0.000
0.000 | 0.000
0.000 | 0.055
0.000 | 0.000
0.940 | 1.000
0.000 | 0.000
0.000 | 0.000
| Plot | Mito | Lyso | Perox | ER | Golgi | PM | Cytosol | Nucleus | |||||
| Expt A |
10 peptides |
21 spectra |
|
0.000 0.000 | 0.000 |
0.000 0.000 | 0.000 |
0.000 0.000 | 0.000 |
0.021 0.000 | 0.055 |
0.000 0.000 | 0.000 |
0.979 0.940 | 1.000 |
0.000 0.000 | 0.000 |
0.000 0.000 | 0.000 |
| 4 spectra, WTLGATQVLR | 0.000 | 0.036 | 0.000 | 0.000 | 0.000 | 0.964 | 0.000 | 0.000 | ||
| 3 spectra, NKPVPSR | 0.000 | 0.000 | 0.000 | 0.012 | 0.000 | 0.988 | 0.000 | 0.000 | ||
| 1 spectrum, YLMNVPGK | 0.000 | 0.072 | 0.000 | 0.004 | 0.018 | 0.907 | 0.000 | 0.000 | ||
| 2 spectra, DLVPGSR | 0.000 | 0.000 | 0.000 | 0.000 | 0.000 | 1.000 | 0.000 | 0.000 | ||
| 3 spectra, VSSACVLVGR | 0.112 | 0.000 | 0.000 | 0.640 | 0.000 | 0.228 | 0.000 | 0.020 | ||
| 1 spectrum, LLDGQDLVPR | 0.000 | 0.000 | 0.000 | 0.000 | 0.000 | 1.000 | 0.000 | 0.000 | ||
| 1 spectrum, TGAQYILLPCASALCGVSVK | 0.000 | 0.000 | 0.156 | 0.000 | 0.000 | 0.644 | 0.200 | 0.000 | ||
| 1 spectrum, GSLGVDGDGVALLHVTR | 0.000 | 0.088 | 0.091 | 0.000 | 0.000 | 0.821 | 0.000 | 0.000 | ||
| 4 spectra, CAVPQTR | 0.000 | 0.000 | 0.000 | 0.076 | 0.000 | 0.924 | 0.000 | 0.000 | ||
| 1 spectrum, LLHSSGAVR | 0.000 | 0.284 | 0.000 | 0.000 | 0.000 | 0.614 | 0.102 | 0.000 |
| Plot | Mito | Lyso or Perox | ER | Golgi | PM | Cytosol | Nucleus | ||||||
| Expt B |
2 peptides |
2 spectra |
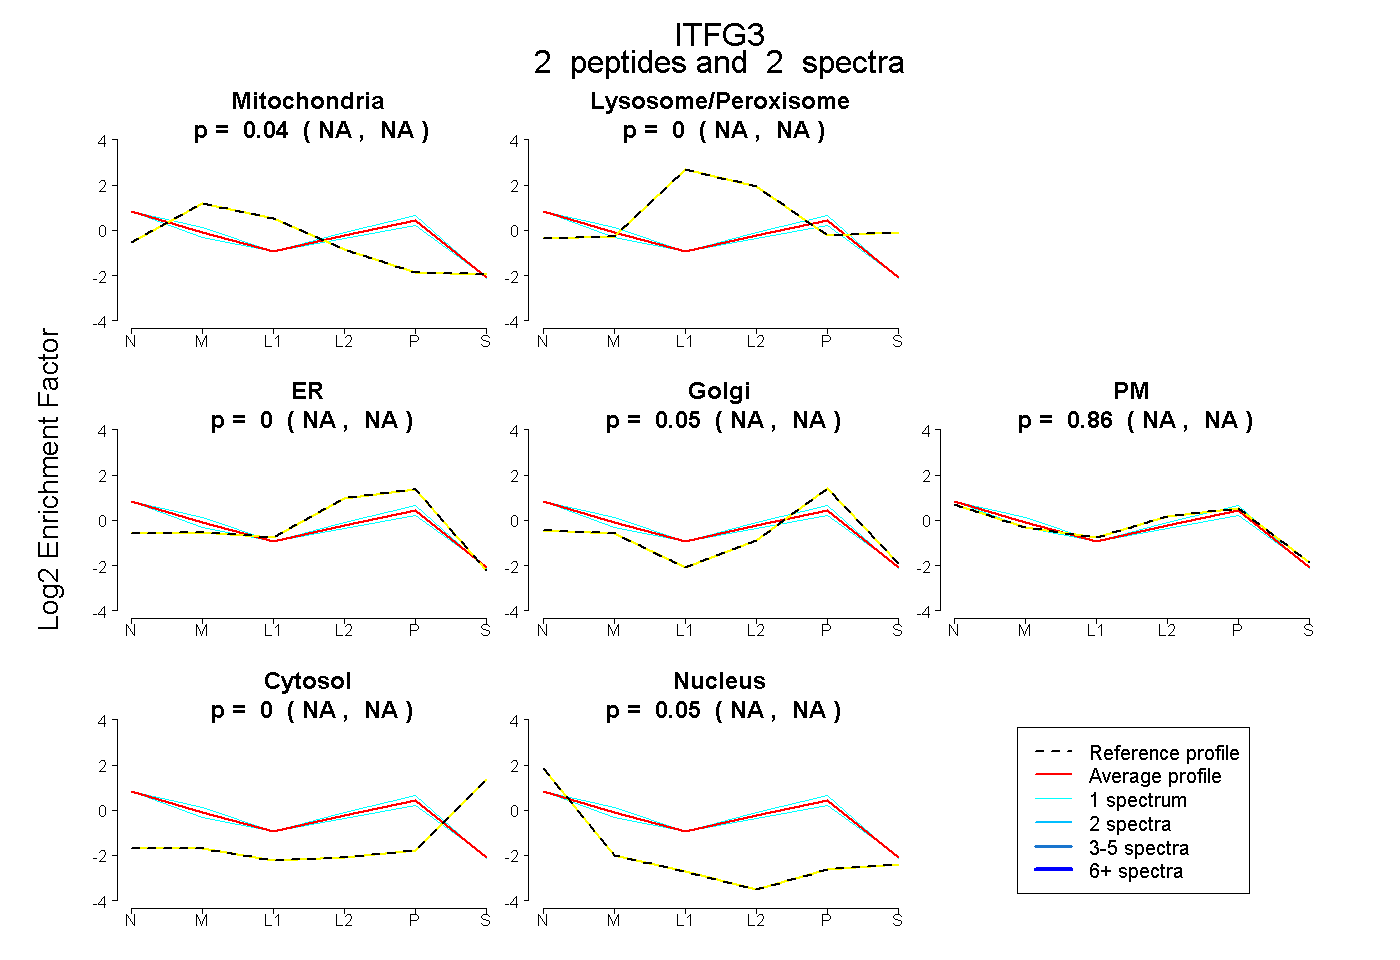 |
0.040 NA | NA |
0.000 NA | NA |
0.000 NA | NA |
0.050 NA | NA |
0.858 NA | NA |
0.000 NA | NA |
0.053 NA | NA |
|||
| Plot | Lyso | Other | |||||||||||
| Expt C |
11 peptides |
22 spectra |
 |
0.000 0.000 | 0.000 |
1.000 1.000 | 1.000 |
||||||||
| Plot | Lyso | Other | |||||||||||
| Expt D |
4 peptides |
7 spectra |
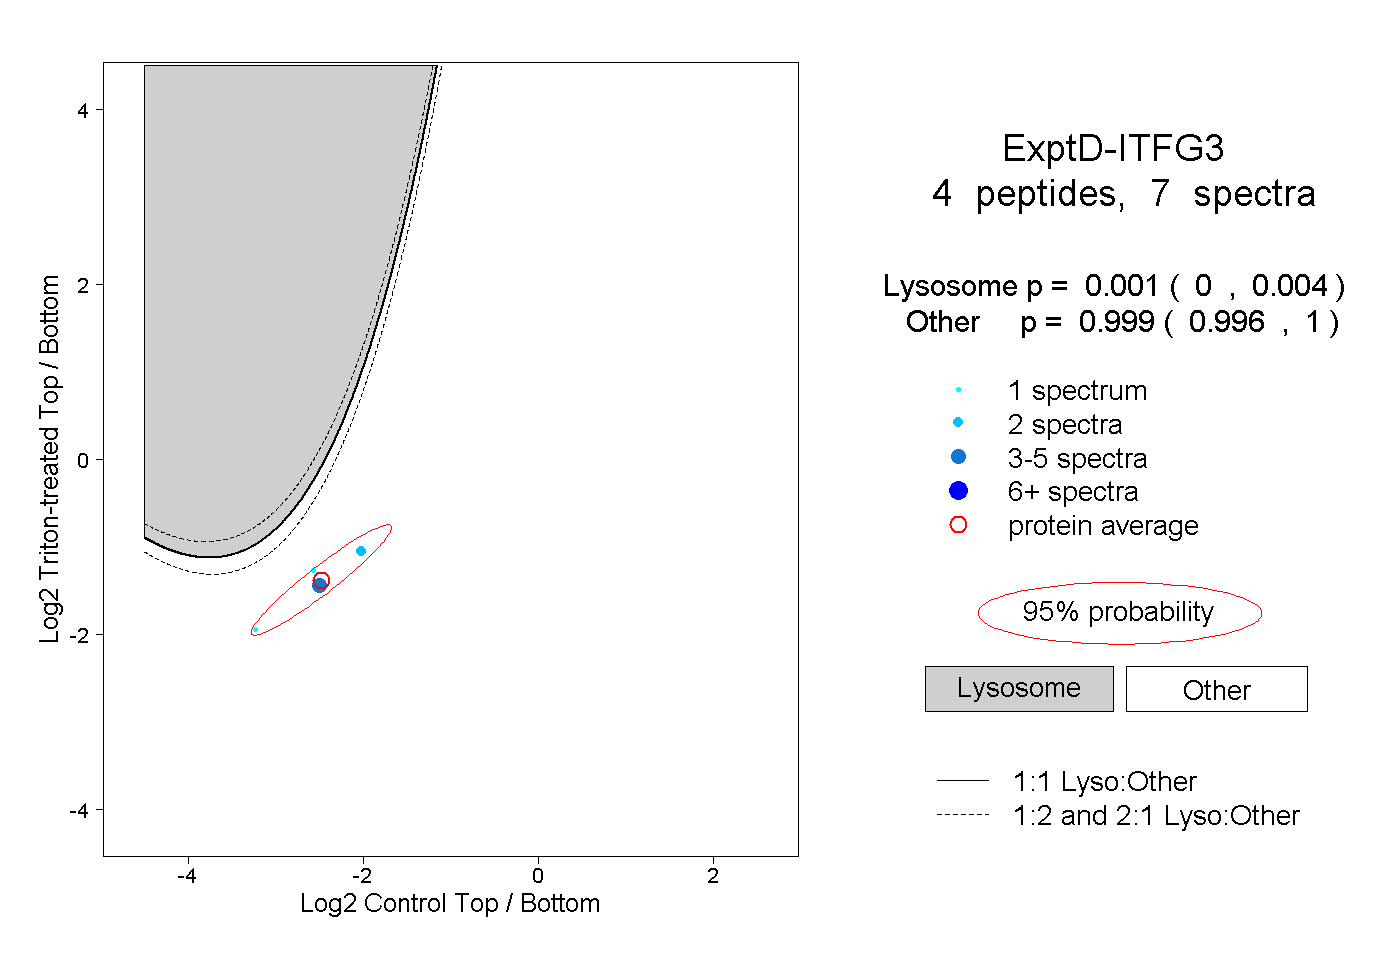 |
0.001 0.000 | 0.004 |
0.999 0.996 | 1.000 |