 25
25peptides
spectra
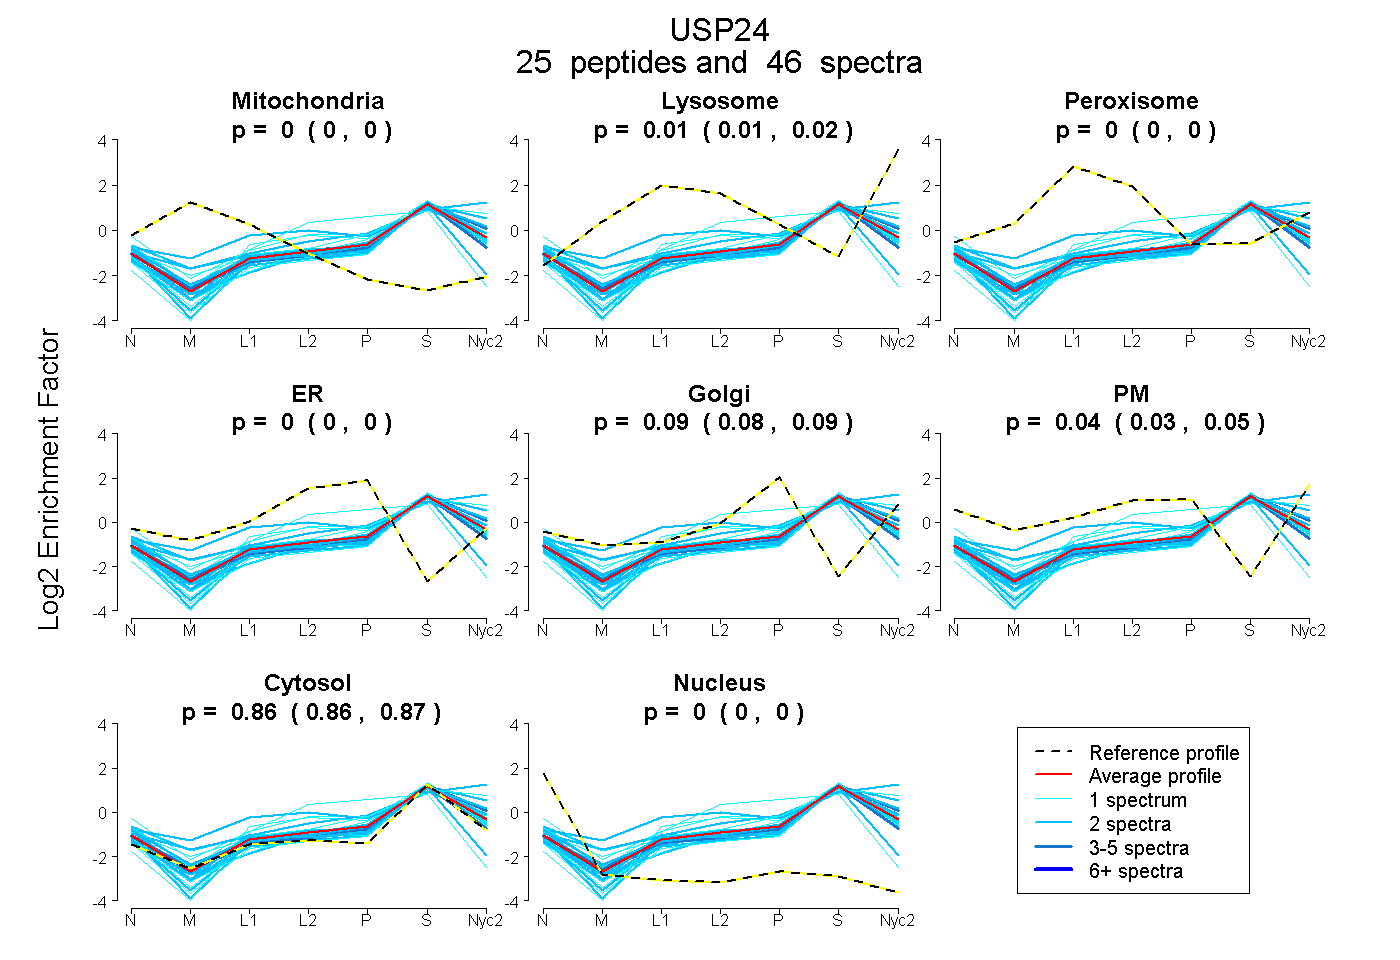
0.000 | 0.000
0.005 | 0.018
0.000 | 0.000
0.000 | 0.000
0.075 | 0.094
0.026 | 0.048
0.860 | 0.867
0.000 | 0.000
9peptides
spectra
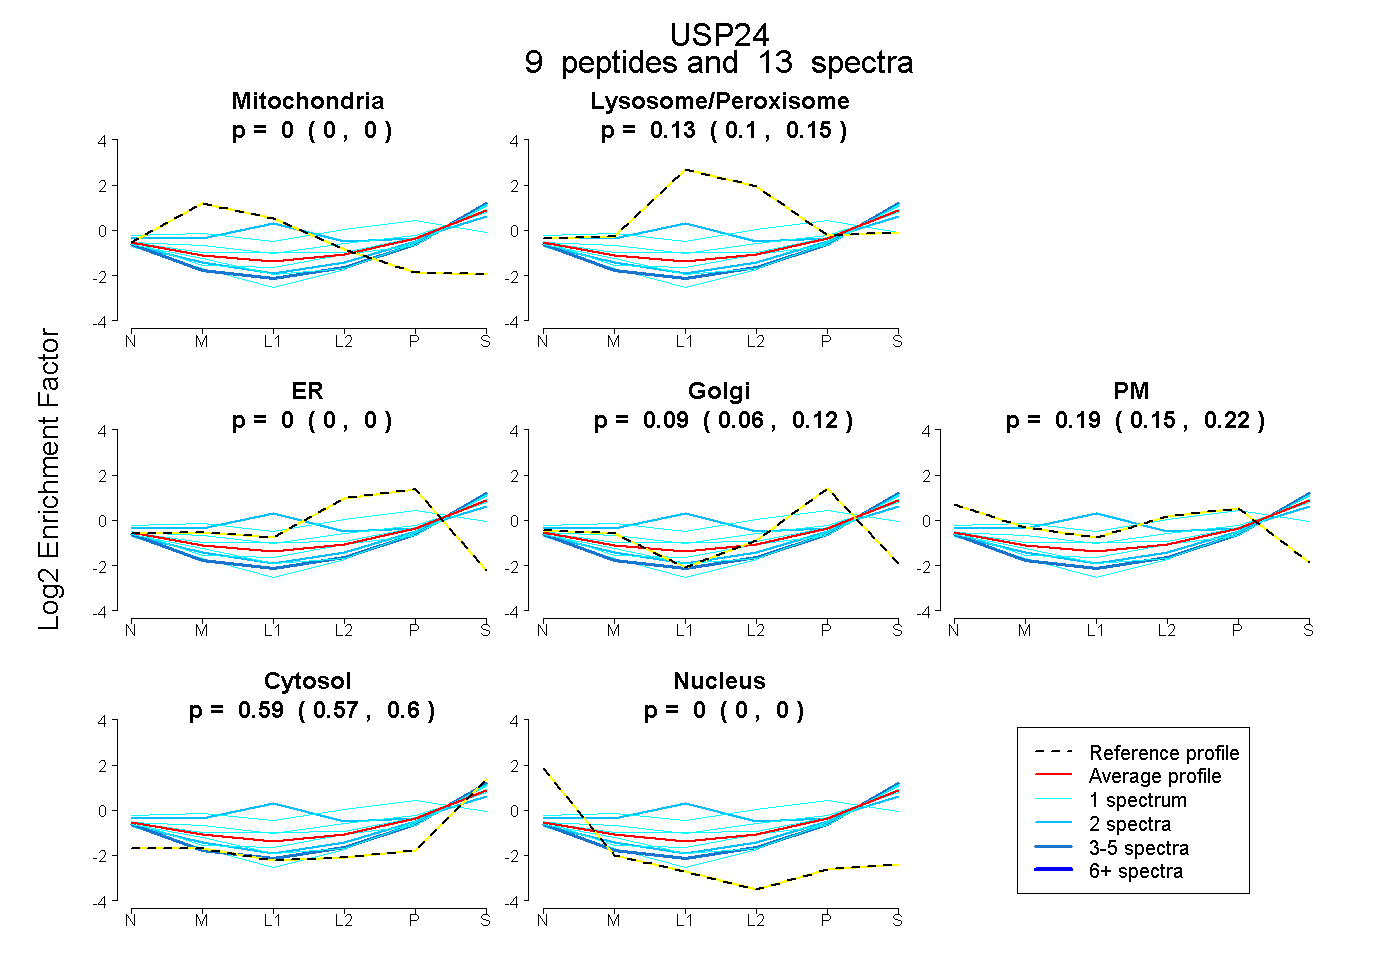
0.000 | 0.000
0.098 | 0.155
0.000 | 0.000
0.063 | 0.121
0.148 | 0.221
0.572 | 0.604
0.000 | 0.000
20peptides
spectra

0.000 | 0.000
1.000 | 1.000
1peptide
spectra
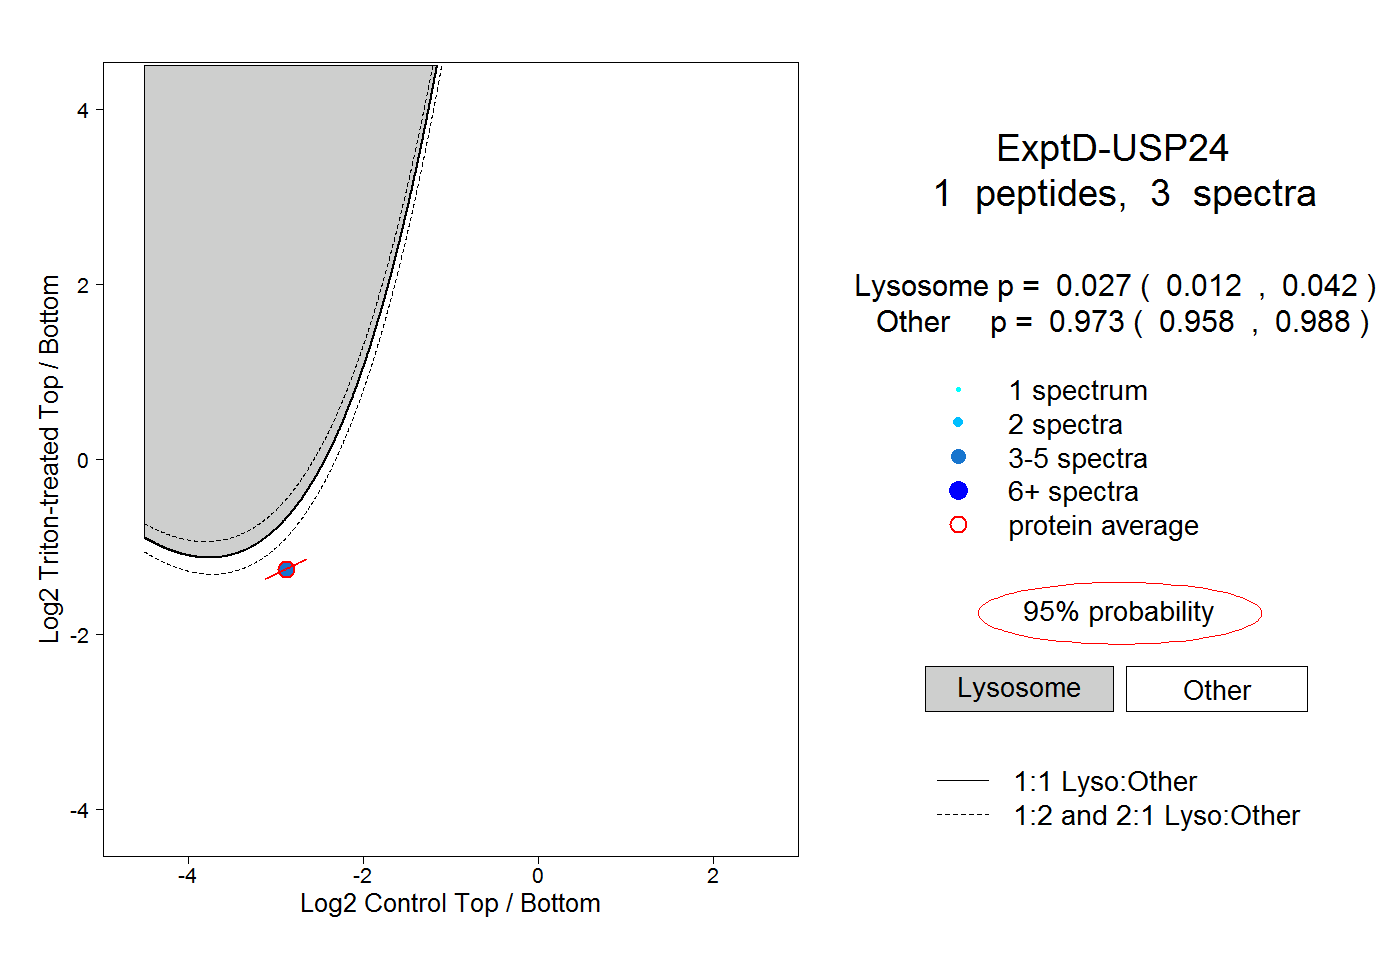
0.012 | 0.042
0.958 | 0.988