TMED9
[ENSRNOP00000030668]
Main page
| | | Plot |
Mito |
Lyso |
|
Perox |
ER |
Golgi |
PM |
Cytosol |
Nucleus |
|
| Expt A |
 11
11
peptides |
81
spectra |
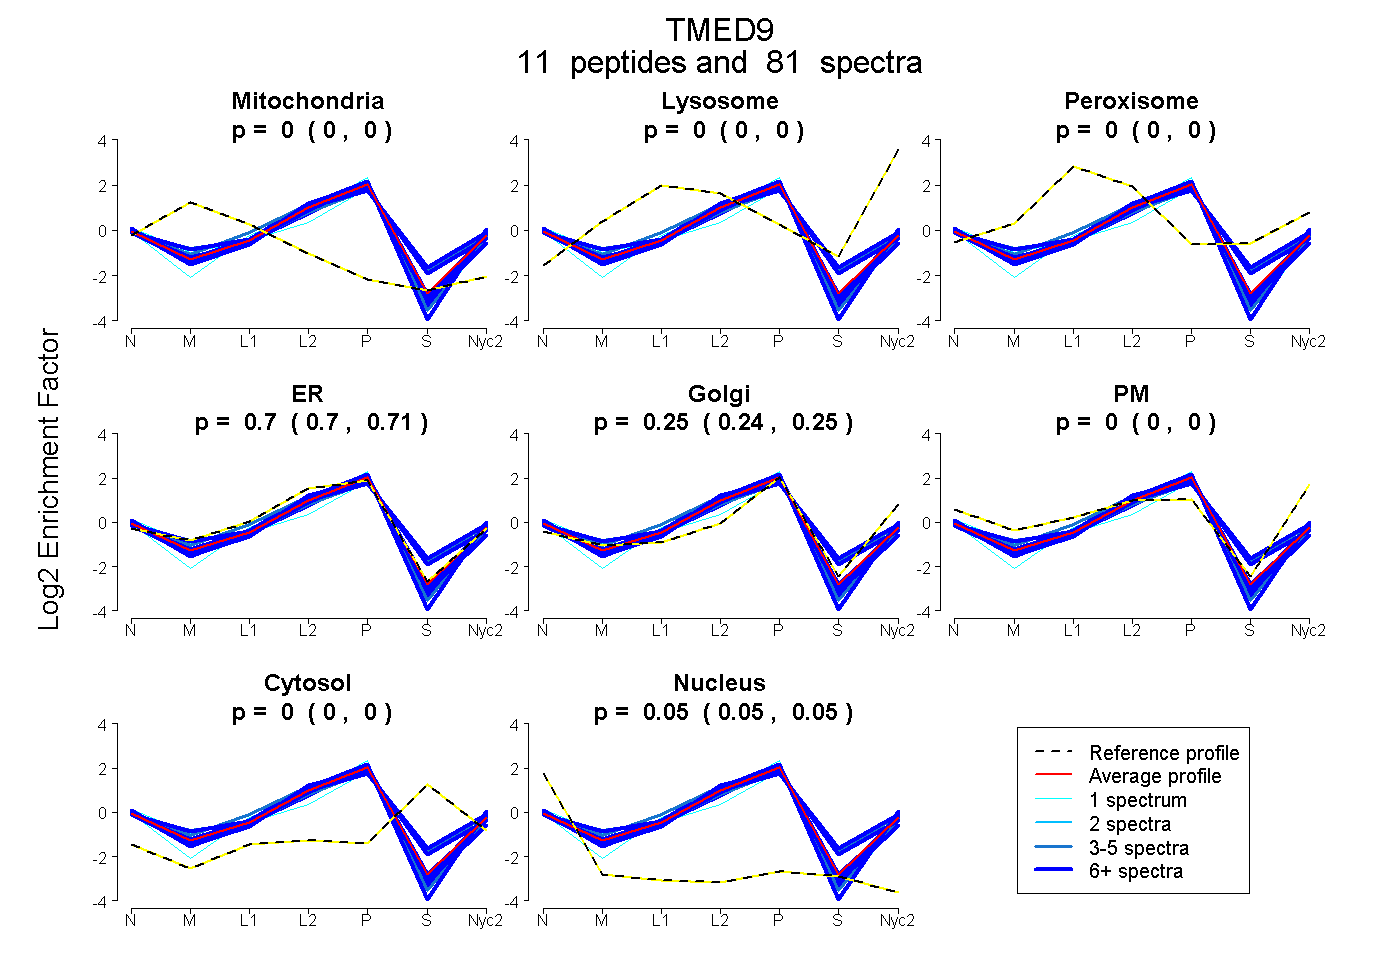 |
0.000
0.000 | 0.000 |
0.000
0.000 | 0.000 |
|
0.000
0.000 | 0.000 |
0.704
0.698 | 0.709 |
0.249
0.242 | 0.255 |
0.000
0.000 | 0.000 |
0.000
0.000 | 0.000 |
0.047
0.045 | 0.048 |
|
| | | Plot |
Mito |
|
Lyso or Perox |
|
ER |
Golgi |
PM |
Cytosol |
Nucleus |
|
| Expt B |
7
peptides |
18
spectra |
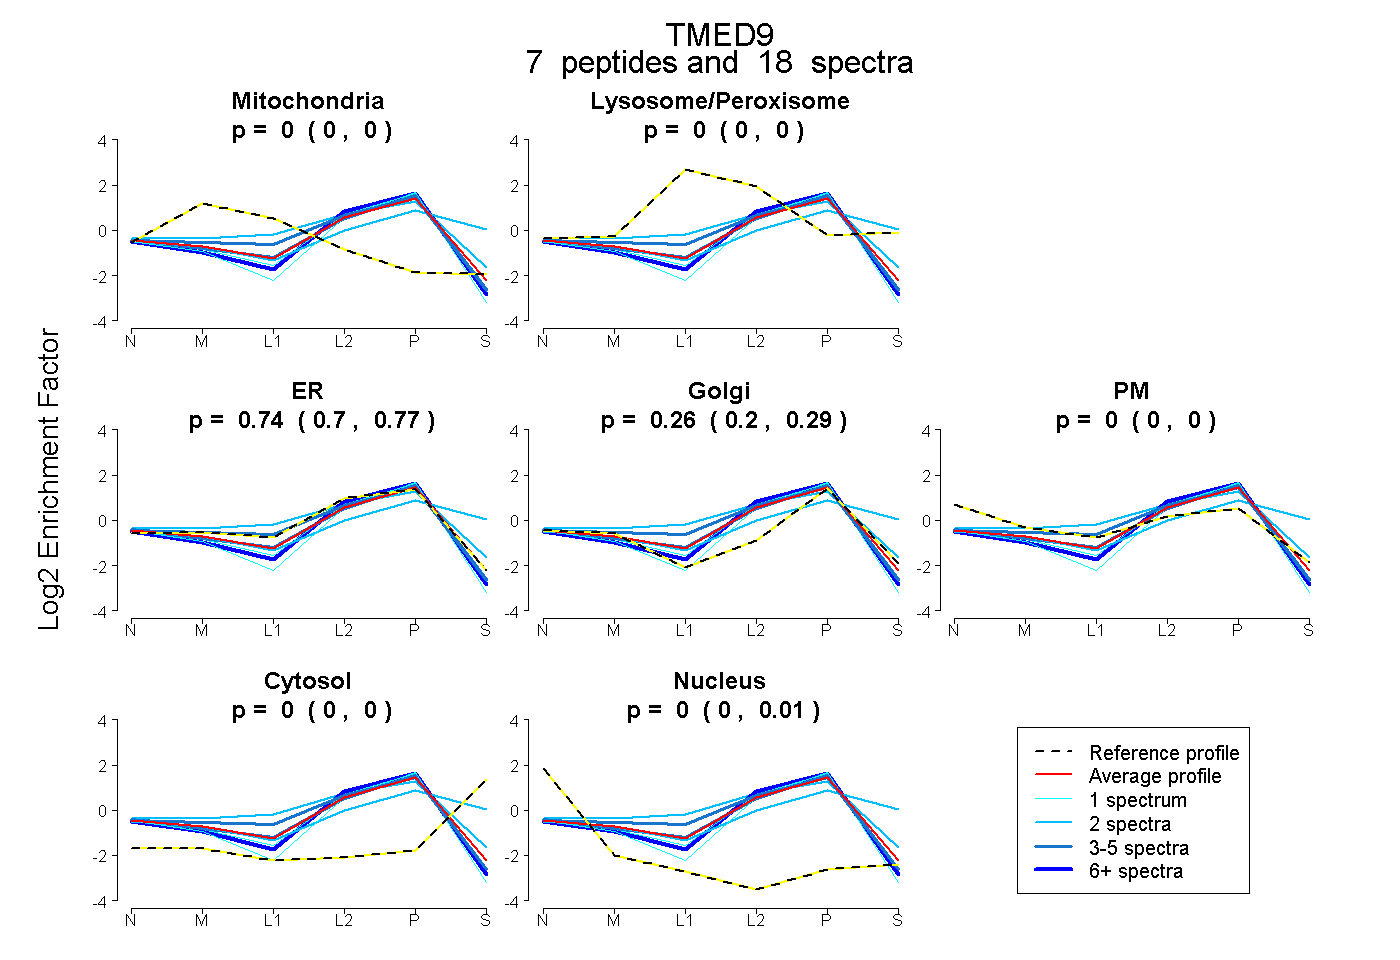 |
0.000
0.000 | 0.000 |
|
0.000
0.000 | 0.000 |
|
0.739
0.701 | 0.773 |
0.256
0.205 | 0.292 |
0.000
0.000 | 0.000 |
0.000
0.000 | 0.000 |
0.005
0.000 | 0.014 |
|
| 2 spectra, EQNYQR |
0.000 |
|
0.214 |
|
0.546 |
0.210 |
0.030 |
0.000 |
0.000 |
|
| 3 spectra, TQLYDK |
0.000 |
|
0.000 |
|
0.965 |
0.009 |
0.000 |
0.000 |
0.026 |
|
| 6 spectra, FSLFAGGMLR |
0.000 |
|
0.000 |
|
0.734 |
0.266 |
0.000 |
0.000 |
0.000 |
|
| 1 spectrum, LSELQLR |
0.000 |
|
0.000 |
|
0.717 |
0.283 |
0.000 |
0.000 |
0.000 |
|
| 3 spectra, QLVEQVEQIQK |
0.000 |
|
0.000 |
|
0.766 |
0.223 |
0.000 |
0.000 |
0.011 |
|
| 2 spectra, QYGSEGR |
0.000 |
|
0.219 |
|
0.064 |
0.483 |
0.000 |
0.234 |
0.000 |
|
| 1 spectrum, SFFEAK |
0.000 |
|
0.000 |
|
0.534 |
0.466 |
0.000 |
0.000 |
0.000 |
|
| | | Plot |
|
Lyso |
|
|
|
|
|
|
|
Other |
| Expt C |
6
peptides |
45
spectra |
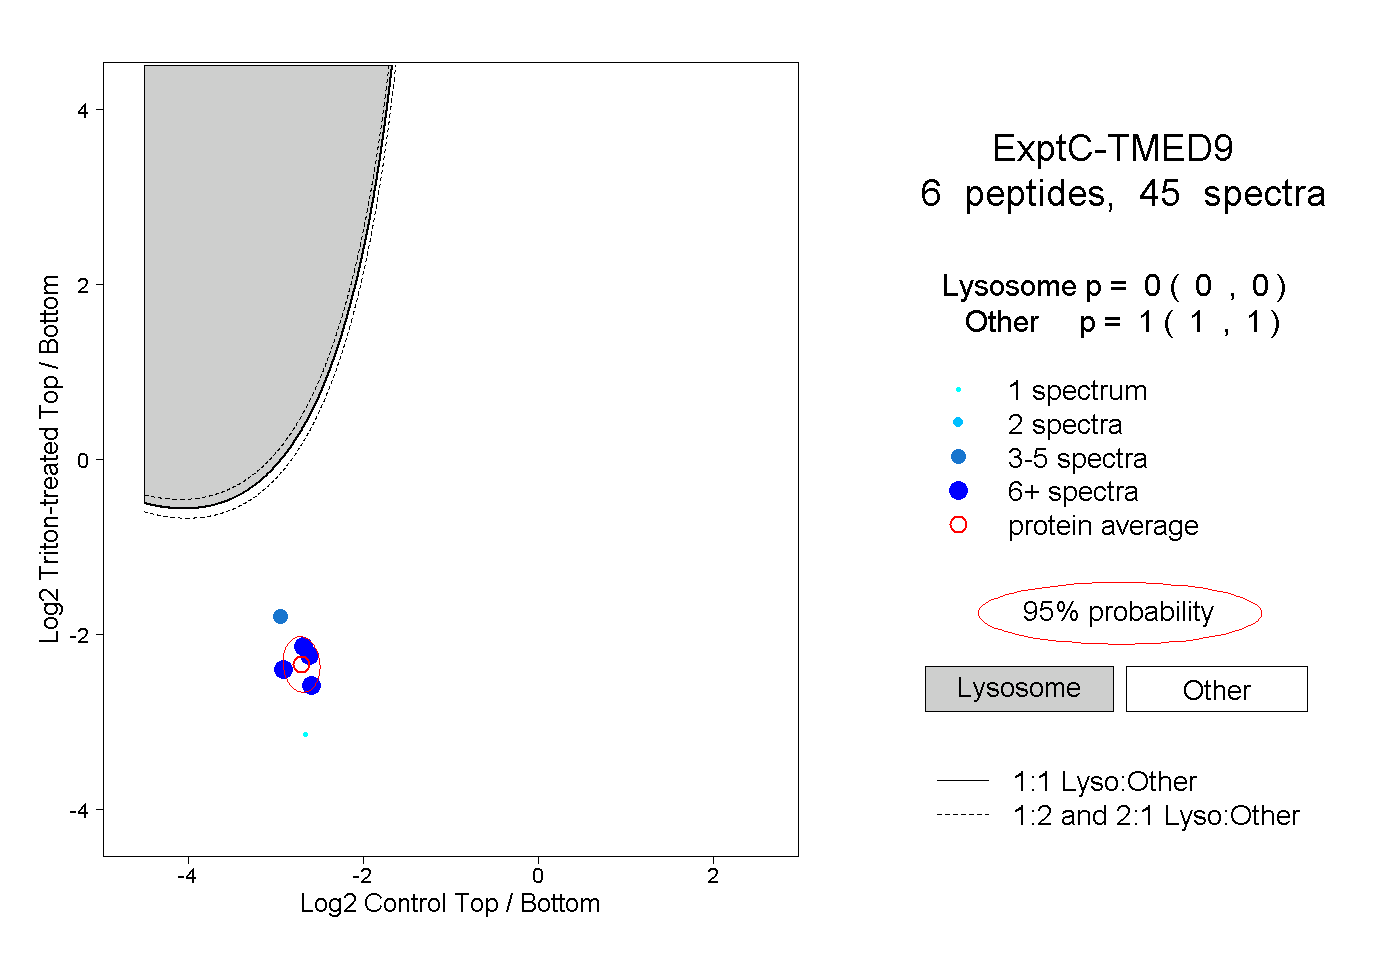 |
|
0.000
0.000 | 0.000 |
|
|
|
|
|
|
|
1.000
1.000 | 1.000 |
| | | Plot |
|
Lyso |
|
|
|
|
|
|
|
Other |
| Expt D |
3
peptides |
12
spectra |
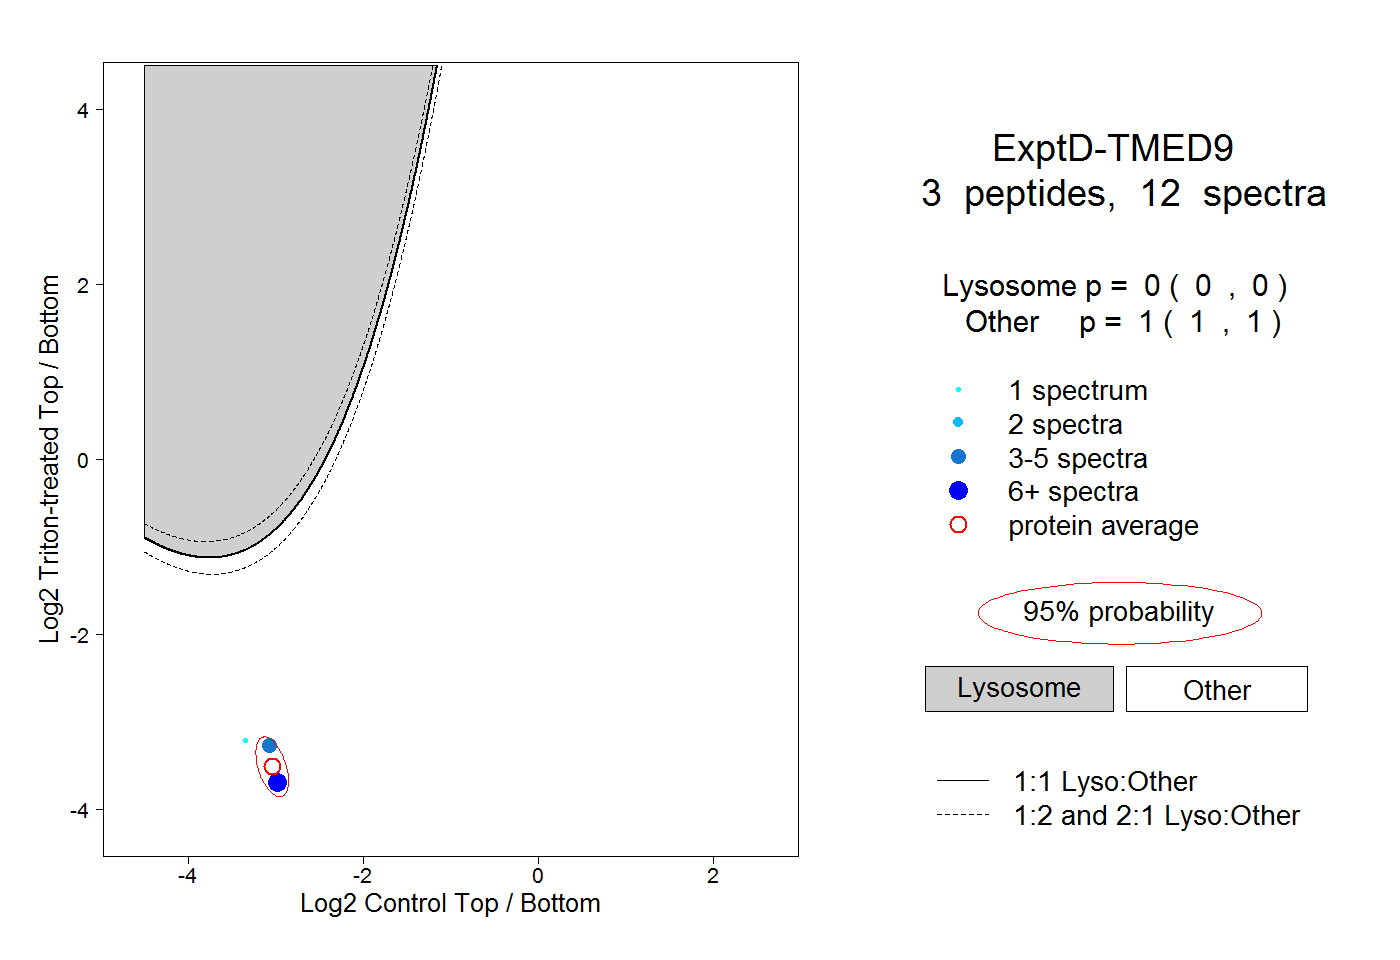 |
|
0.000
0.000 | 0.000 |
|
|
|
|
|
|
|
1.000
1.000 | 1.000 |