 1
1peptide
spectra

0.000 | 0.000
0.000 | 0.000
0.000 | 0.000
0.045 | 0.142
0.000 | 0.000
0.308 | 0.418
0.503 | 0.521
0.007 | 0.032
1peptide
spectra
0.000 | 0.000
1.000 | 1.000
| Plot | Mito | Lyso | Perox | ER | Golgi | PM | Cytosol | Nucleus | |||||
| Expt A |
1 peptide |
4 spectra |
|
0.000 0.000 | 0.000 |
0.000 0.000 | 0.000 |
0.000 0.000 | 0.000 |
0.095 0.045 | 0.142 |
0.000 0.000 | 0.000 |
0.371 0.308 | 0.418 |
0.513 0.503 | 0.521 |
0.021 0.007 | 0.032 |
||
| Plot | Lyso | Other | |||||||||||
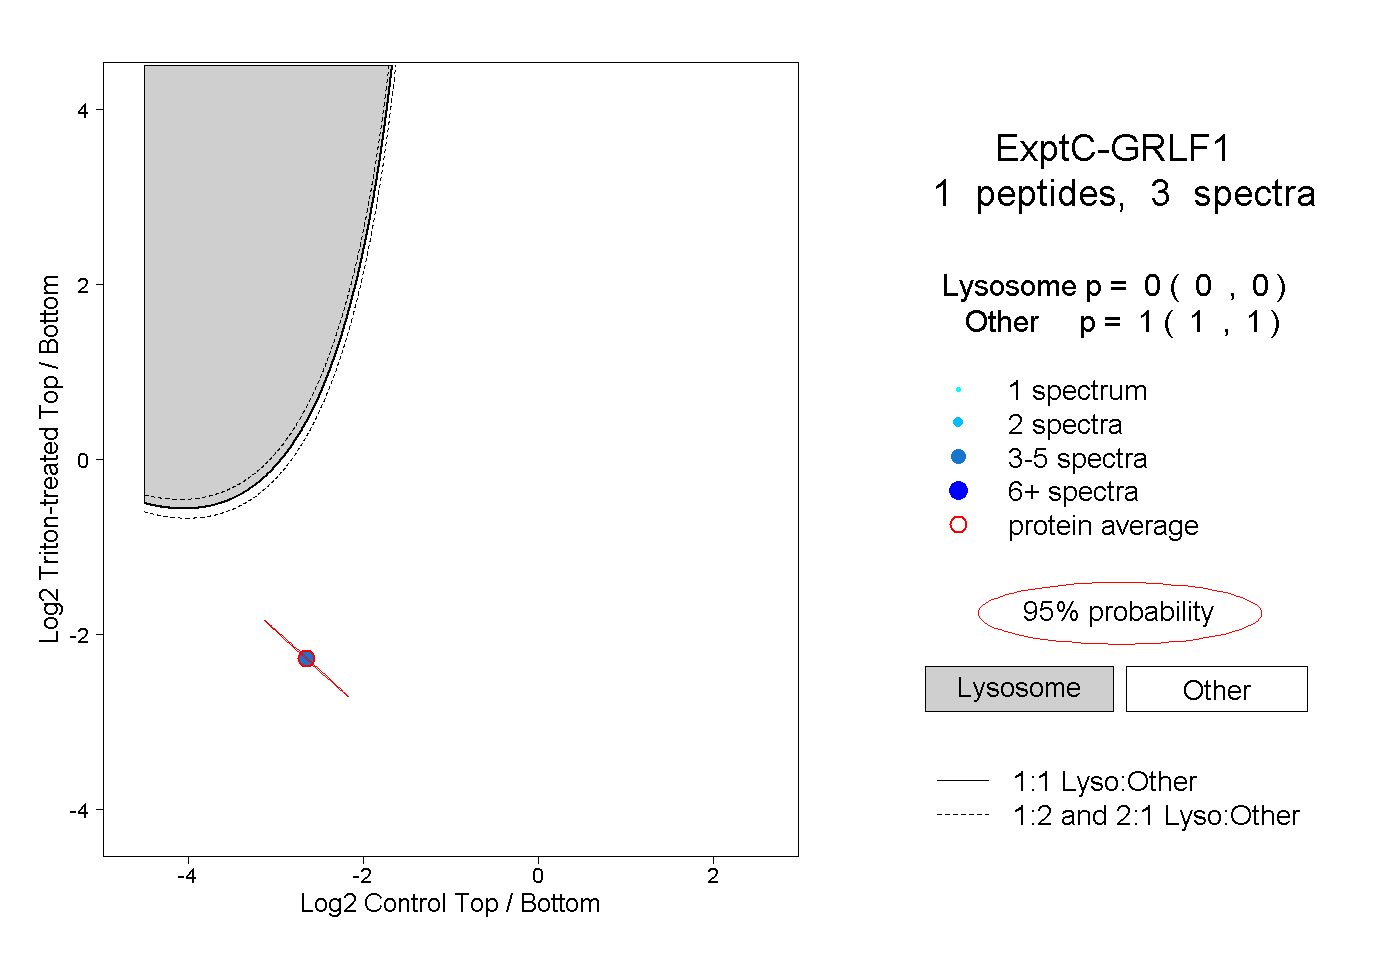
| Expt C |
1 peptide |
3 spectra |
|
0.000 0.000 | 0.000 |
1.000 1.000 | 1.000 |