 13
13peptides
spectra
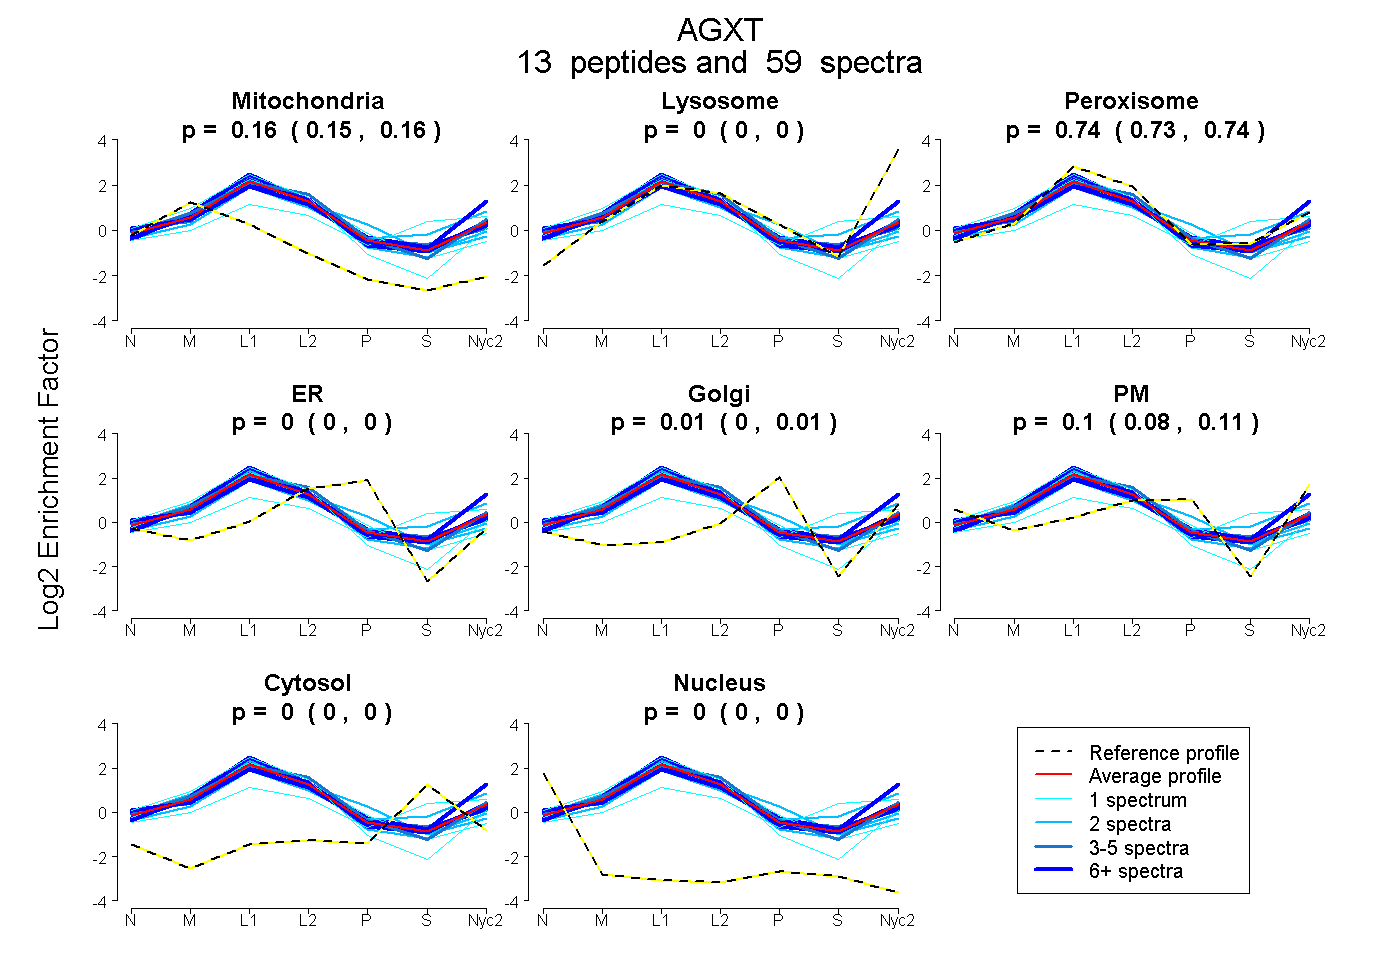
0.151 | 0.159
0.000 | 0.000
0.732 | 0.744
0.000 | 0.000
0.000 | 0.014
0.084 | 0.110
0.000 | 0.000
0.000 | 0.000
9peptides
spectra
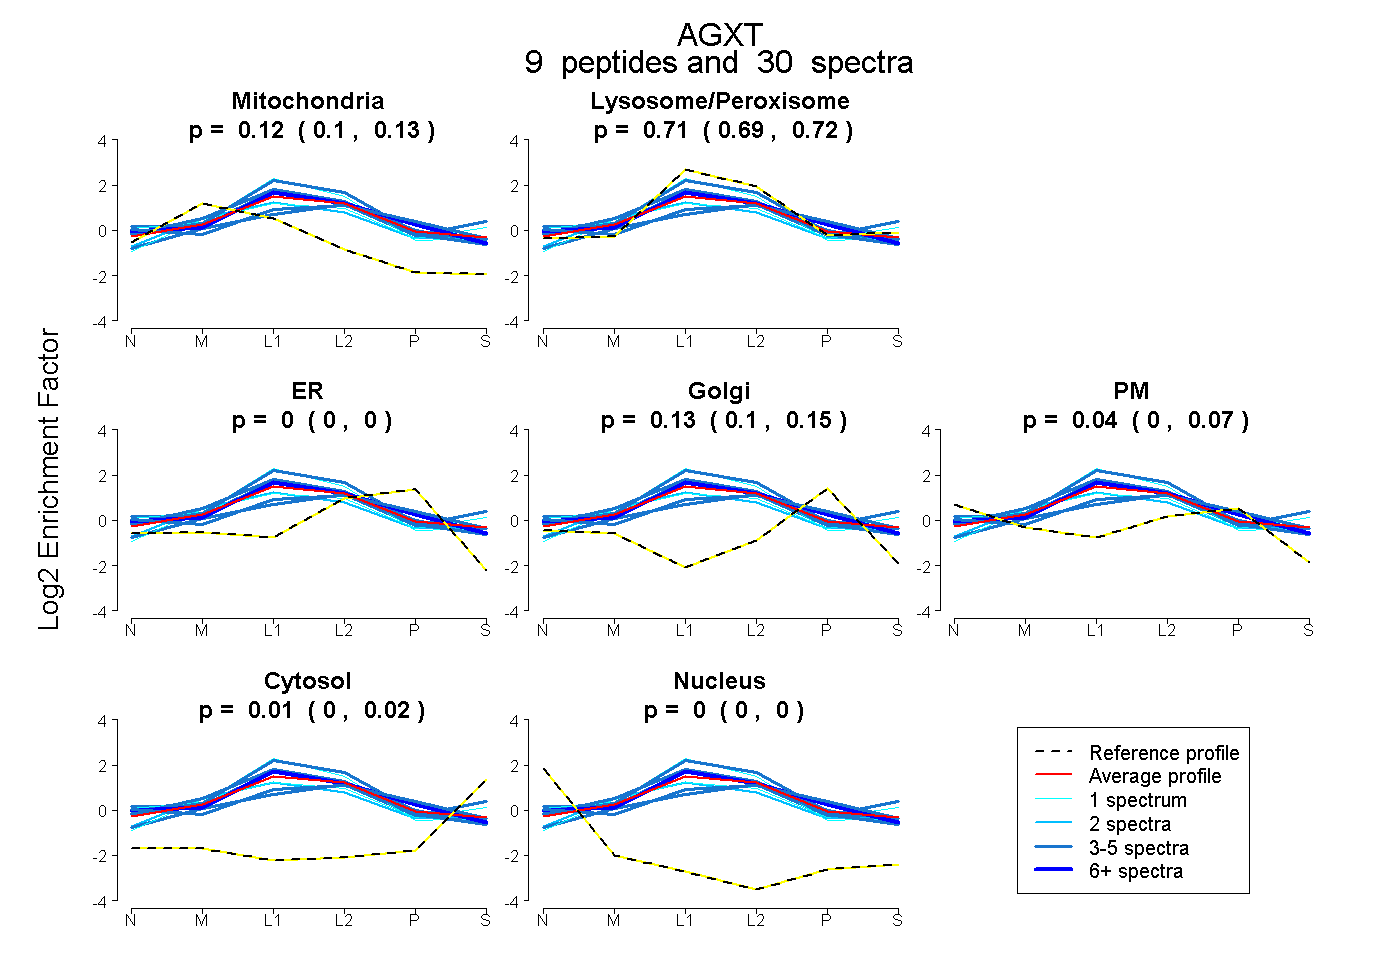
0.104 | 0.127
0.691 | 0.719
0.000 | 0.000
0.099 | 0.150
0.000 | 0.073
0.001 | 0.019
0.000 | 0.000
18peptides
spectra
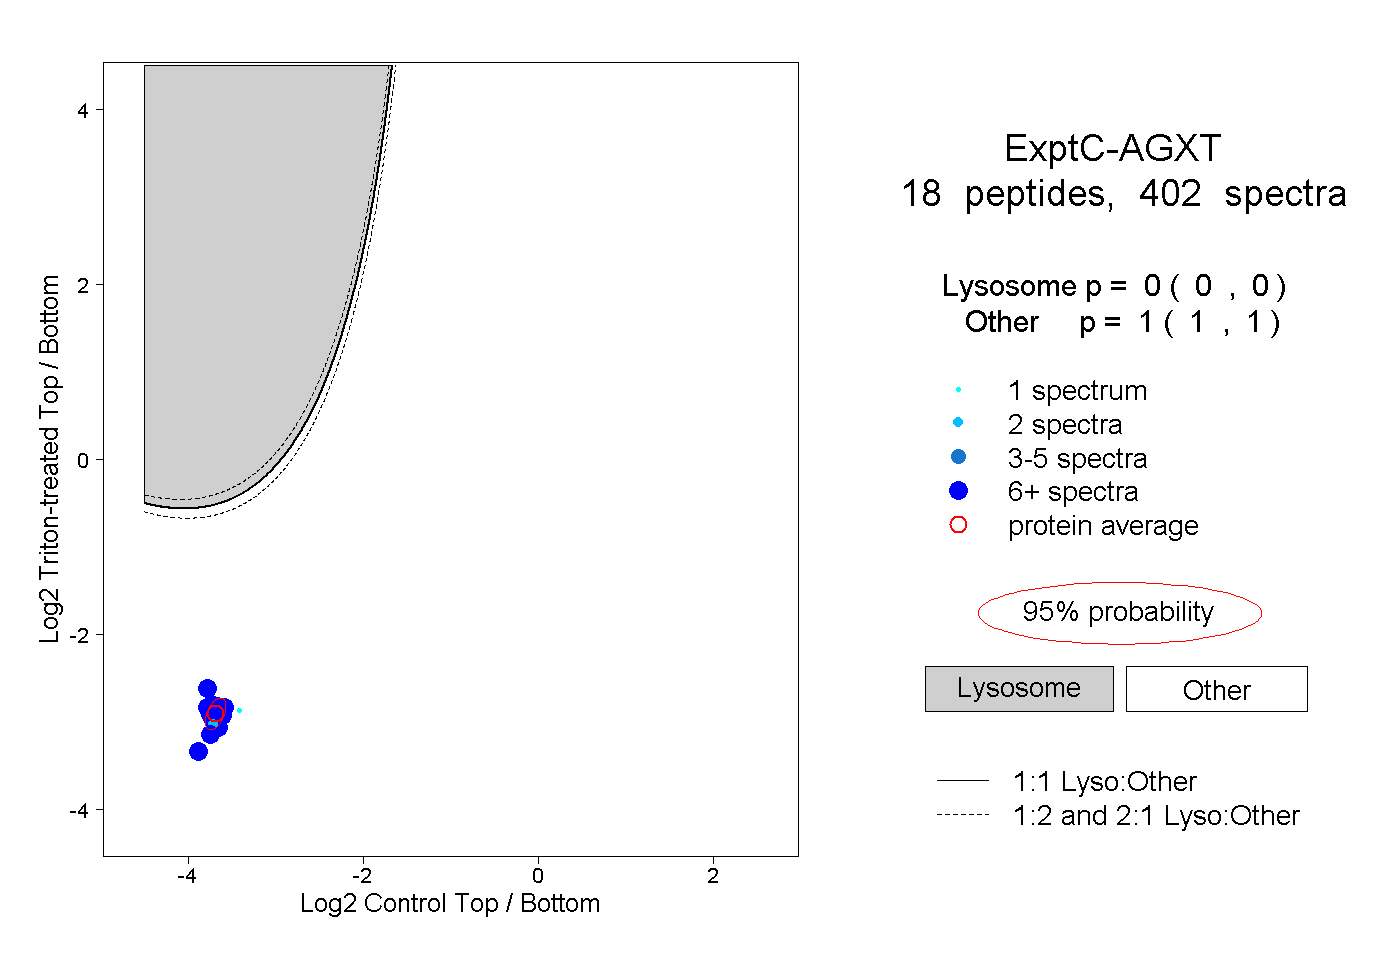
0.000 | 0.000
1.000 | 1.000
9peptides
spectra
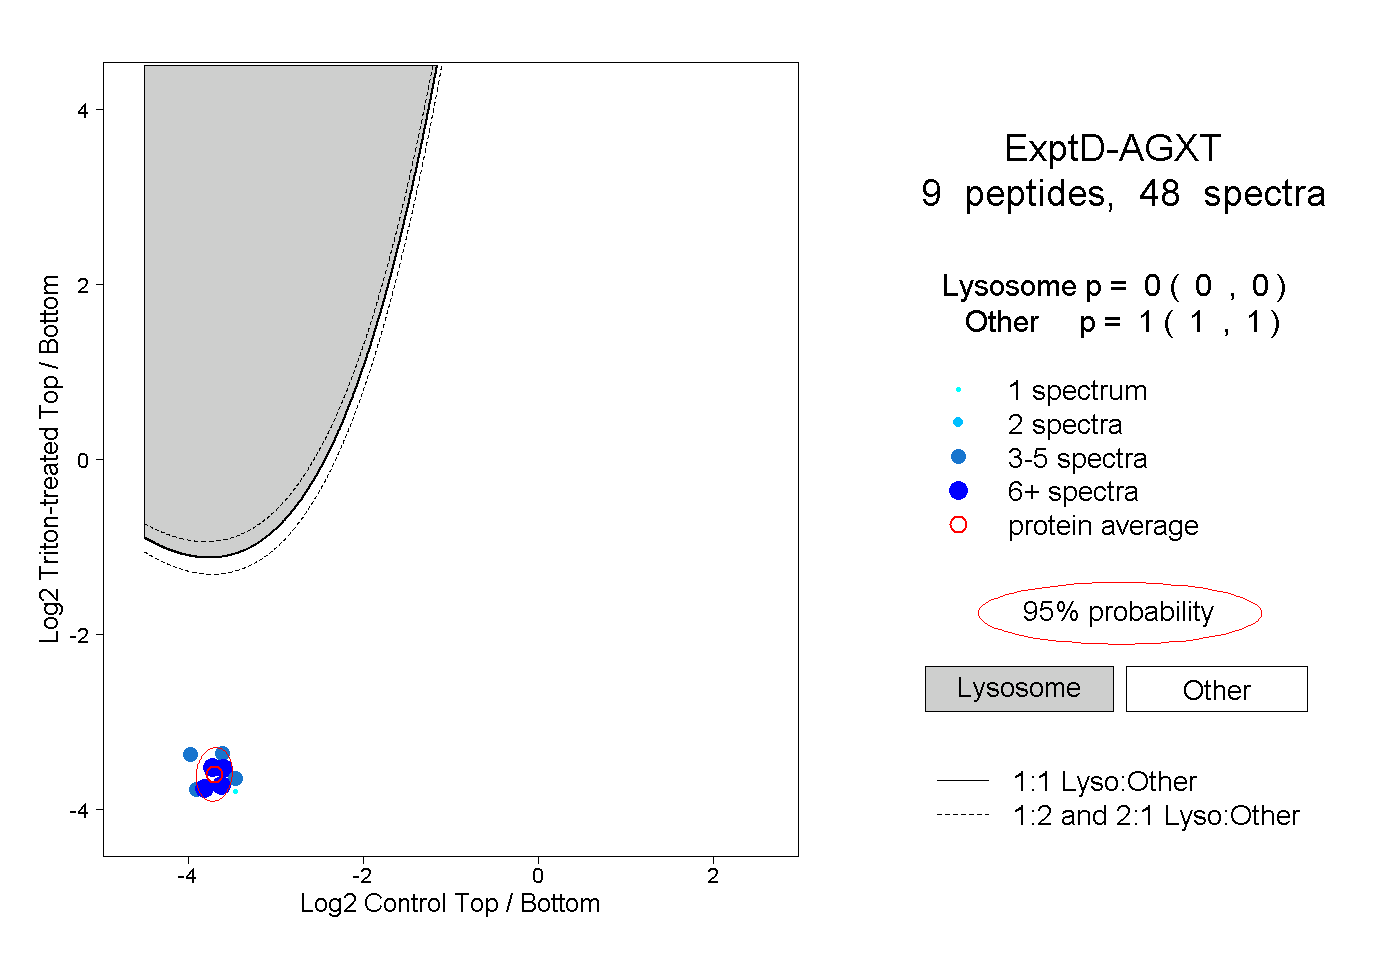
0.000 | 0.000
1.000 | 1.000