 9
9peptides
spectra
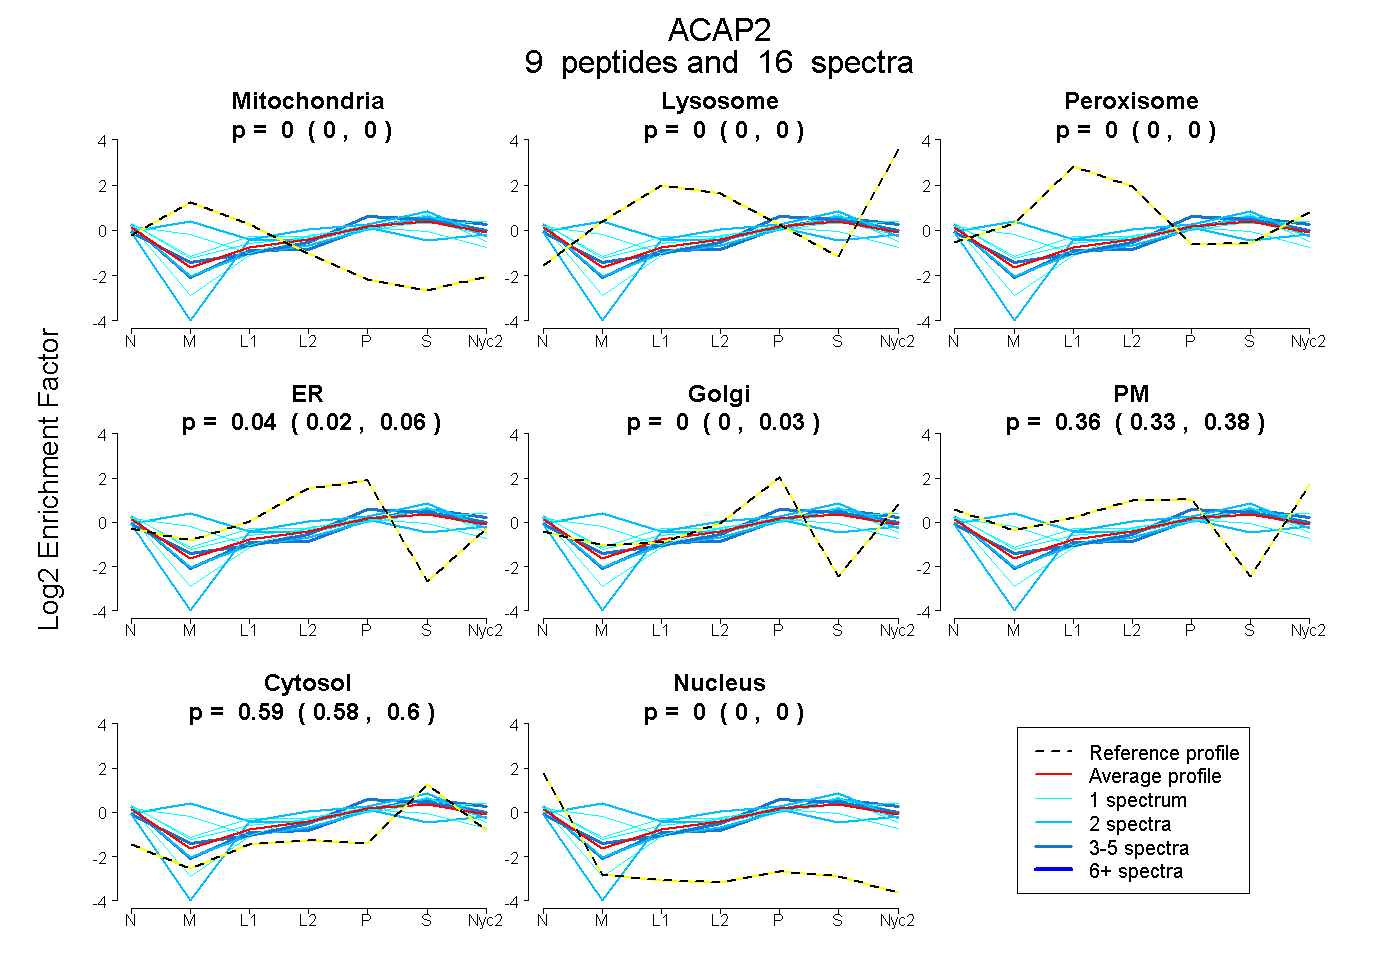
0.000 | 0.000
0.000 | 0.000
0.000 | 0.000
0.018 | 0.059
0.000 | 0.025
0.333 | 0.384
0.580 | 0.603
0.000 | 0.000
| Plot | Mito | Lyso | Perox | ER | Golgi | PM | Cytosol | Nucleus | |||||
| Expt A |
9 peptides |
16 spectra |
|
0.000 0.000 | 0.000 |
0.000 0.000 | 0.000 |
0.000 0.000 | 0.000 |
0.043 0.018 | 0.059 |
0.000 0.000 | 0.025 |
0.364 0.333 | 0.384 |
0.594 0.580 | 0.603 |
0.000 0.000 | 0.000 |
| 1 spectrum, DFSQMASNNPEK | 0.000 | 0.000 | 0.081 | 0.000 | 0.000 | 0.429 | 0.490 | 0.000 | ||
| 1 spectrum, SCMLQADSEK | 0.187 | 0.000 | 0.000 | 0.156 | 0.023 | 0.208 | 0.426 | 0.000 | ||
| 1 spectrum, AQLQNFVK | 0.000 | 0.000 | 0.078 | 0.017 | 0.000 | 0.340 | 0.535 | 0.030 | ||
| 3 spectra, AVQTSIATAYR | 0.000 | 0.000 | 0.000 | 0.000 | 0.054 | 0.308 | 0.638 | 0.000 | ||
| 2 spectra, LCIAMIDTGK | 0.000 | 0.000 | 0.000 | 0.263 | 0.000 | 0.023 | 0.714 | 0.000 | ||
| 2 spectra, ASNAFK | 0.249 | 0.000 | 0.124 | 0.000 | 0.226 | 0.148 | 0.253 | 0.000 | ||
| 2 spectra, DSPTVVVEDLR | 0.000 | 0.000 | 0.000 | 0.000 | 0.027 | 0.313 | 0.652 | 0.008 | ||
| 3 spectra, HLNPGLQLYR | 0.000 | 0.000 | 0.000 | 0.000 | 0.240 | 0.207 | 0.553 | 0.000 | ||
| 1 spectrum, HCEDIER | 0.000 | 0.000 | 0.000 | 0.142 | 0.000 | 0.140 | 0.691 | 0.027 |
| Plot | Mito | Lyso or Perox | ER | Golgi | PM | Cytosol | Nucleus | ||||||
| Expt B |
1 peptide |
1 spectrum |
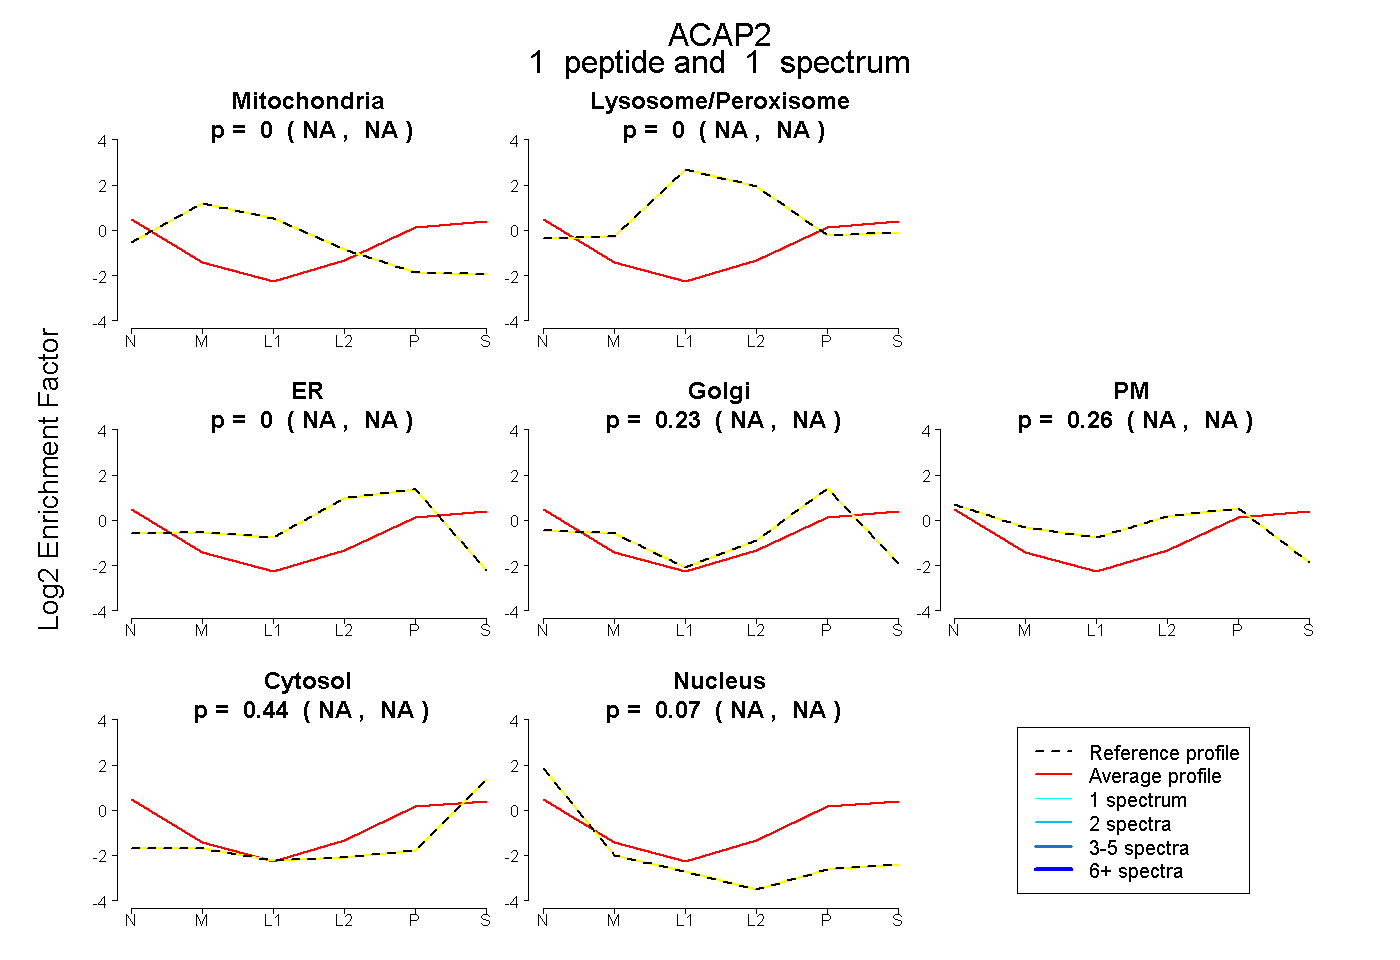 |
0.000 NA | NA |
0.000 NA | NA |
0.000 NA | NA |
0.230 NA | NA |
0.260 NA | NA |
0.436 NA | NA |
0.075 NA | NA |
|||
| Plot | Lyso | Other | |||||||||||
| Expt C |
7 peptides |
21 spectra |
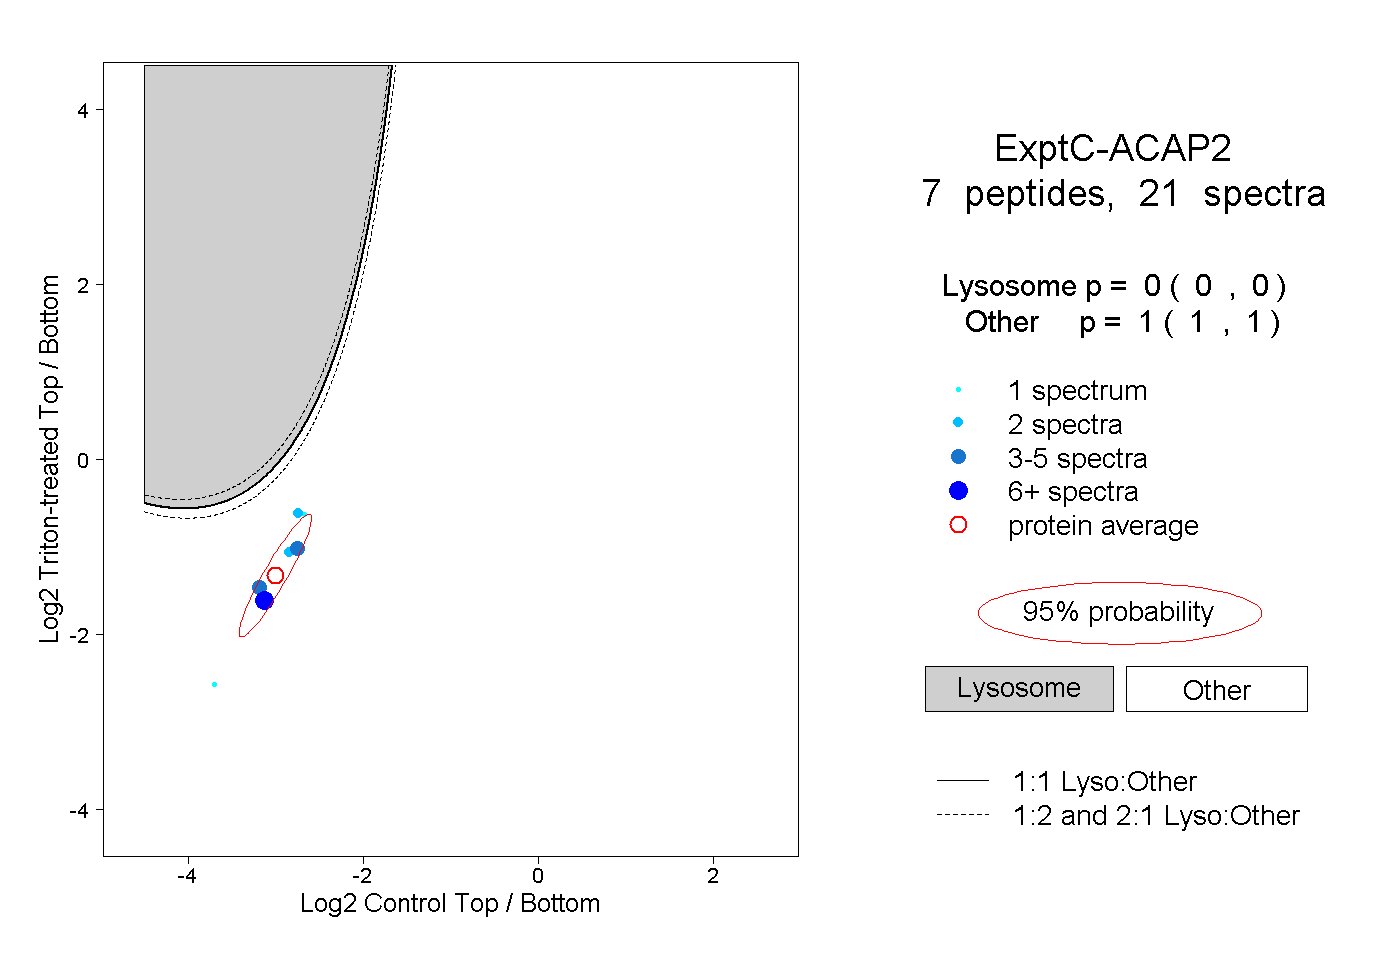 |
0.000 0.000 | 0.000 |
1.000 1.000 | 1.000 |